Monitor Window
The Monitor Window displays log data captured during monitoring in real time. Main features are as follows.
| Feature | Description |
|---|---|
| Per-channel tab display | Up to 8 channels of bus data can be viewed by switching tabs, enabling efficient multi-bus monitoring. |
| Single View / Dual View | - Single View: large display for one channel - Dual View: two channels displayed side-by-side |
| CAN bus traffic graph | Real-time graph of communication load (bus utilization) for each channel. |
This allows simultaneous monitoring of multiple buses while quickly checking load status.
Monitor Window Screen Description
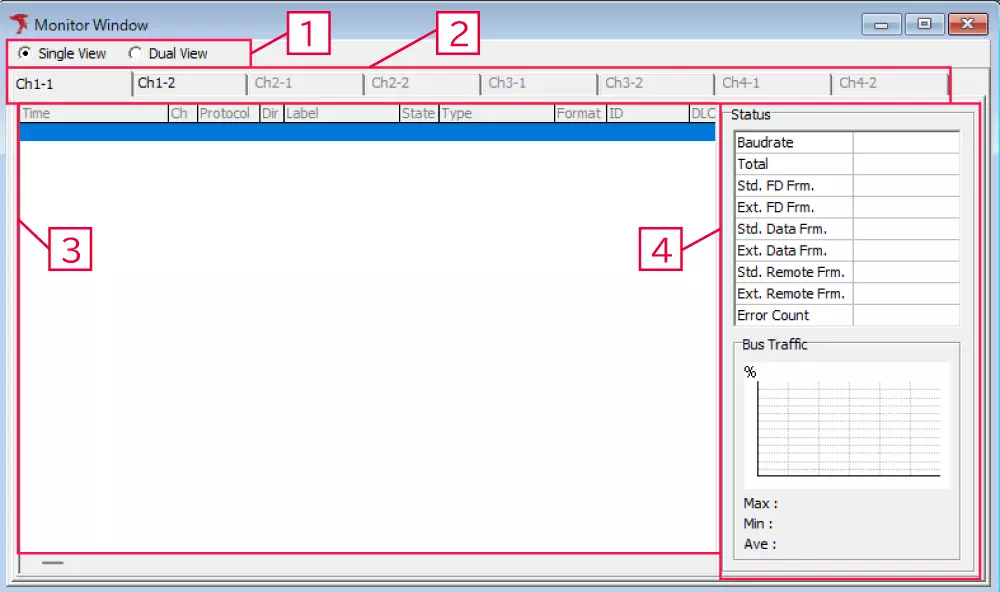
| No. | Item | Description |
|---|---|---|
| 1 | Single View / Dual View switch radio button | Switches Monitor Window display between Single View and Dual View. |
| 2 | Display channel tabs | Switches displayed CAN bus channel according to connected MicroPeckerX units. Up to 8 channels can be displayed. |
| 3 | Log display area | Displays CAN bus monitoring data. |
| 4 | Status | Displays monitoring information and CAN bus load status. |
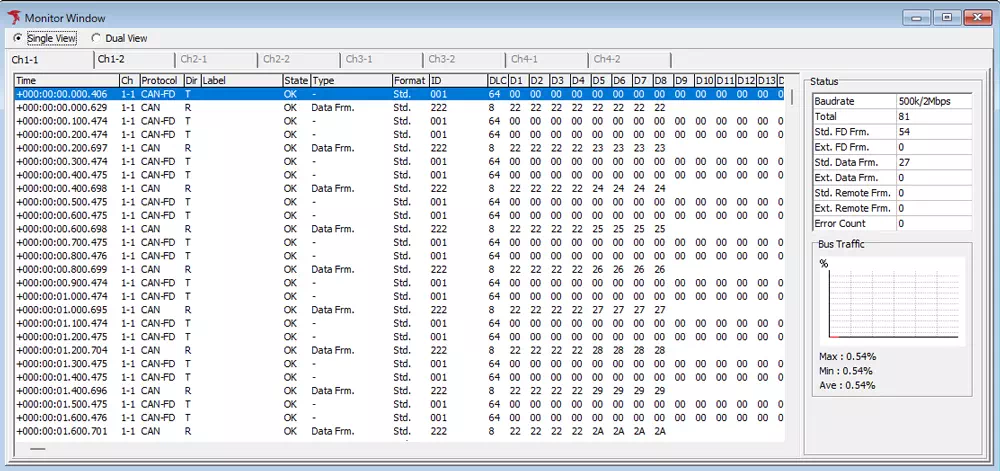
Monitor Log Display Contents
Log items are described below.
| Item | Description |
|---|---|
| Time | Displays transmit/receive timestamp. (note1) |
| Ch | Displays transmit/receive channel. |
| Protocol | Displays transmit/receive protocol. |
| Dir | Displays transmit (T) / receive (R). |
| Label | Displays labels set in Label Filter. |
| State | Displays OK/NG. OK for normal frames, NG for error frames. |
| Type | Displays frame type: - Data Frm. (CAN only, note2) - Remote Frm. (CAN only, note2) - Ack Err. - Error - OverLoad Frm. |
| Format | Displays Standard ID (Std) / Extended ID (Ext). |
| ID | Displays transmitted/received ID in hexadecimal. (note3) |
| DLC | Displays transmitted/received DLC. |
| D1~D64 | Displays transmitted/received data in hexadecimal. |
note1: Display format follows Time Stamp Form in Option dialog.
note2: For normal CAN FD frames, - (hyphen) is displayed.
note3: Display format follows CAN/CAN-FD ID Form in Option dialog.
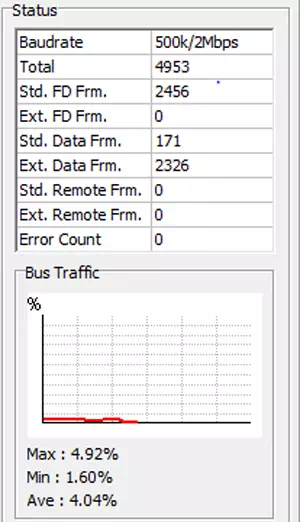
Status Display Contents
Displays bus and traffic status per channel. Status is shown only in Single View.
| Item | Description | |
|---|---|---|
| Baudrate | Configured baud rate | |
| Total | Number of normally received frames | |
| Std. FD Frm. | Number of normally received standard-ID data frames (CAN FD) | |
| Ext. FD Frm. | Number of normally received extended-ID data frames (CAN FD) | |
| Std. Data Frm. | Number of normally received standard-ID data frames | |
| Ext. Data Frm. | Number of normally received extended-ID data frames | |
| Std. Remote Frm. | Number of normally received standard-ID remote frames | |
| Ext. Remote Frm. | Number of normally received extended-ID remote frames | |
| Error Count | Number of error occurrences | |
| Bus Traffic | Graph | Bus load change over the latest 1 minute |
| Average a Second | Bus load over the latest 1 second | |
| Max | Maximum load during monitoring | |
| Min | Minimum load during monitoring | |
| Ave | Average load during monitoring | |
Bus Traffic is calculated using the worst-case value including bit stuffing, so it may exceed 100%.
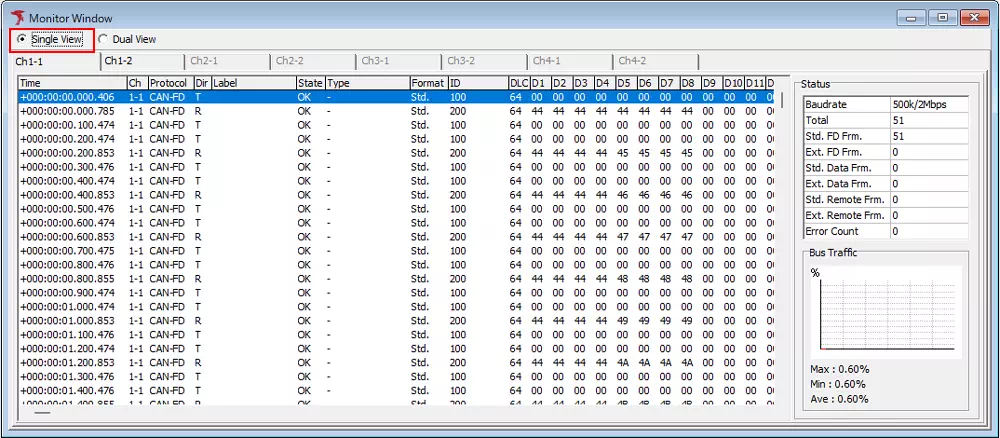
Single View / Dual View Switching
The monitor screen (Monitor Window) can be switched between Single View and Dual View.
Switching is available both when monitoring is stopped and running.
| View mode | Description |
|---|---|
| Single View | Displays monitoring for one channel. You can select the channel with channel tabs. Status and Bus Traffic are shown only in Single View. |
| Dual View | Displays monitoring for two channels simultaneously. You can specify channels with channel selection boxes. |
Single View
Dual View
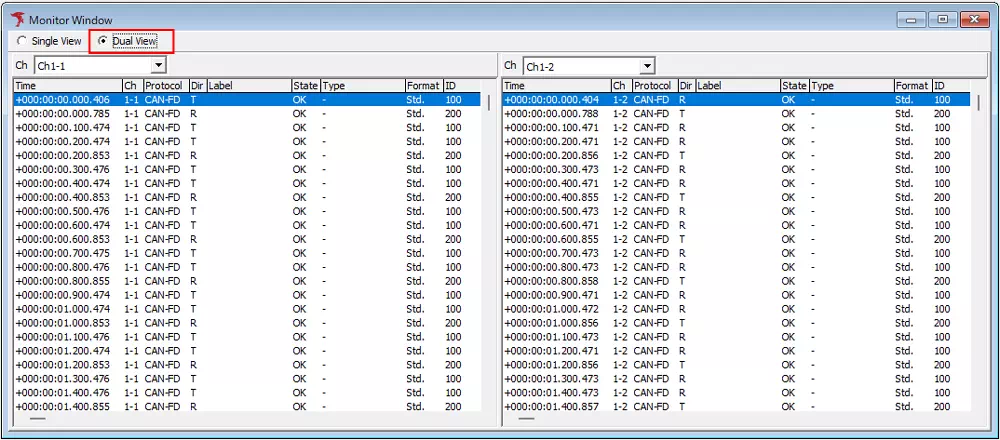
If Filter Enabled is checked for a channel in Display Filter Window, a filter icon is shown in the channel selection box.