Product Usage Flow
This section explains the end-to-end flow from connecting MicroPeckerX CAN FD Analyzer to operation and log analysis.
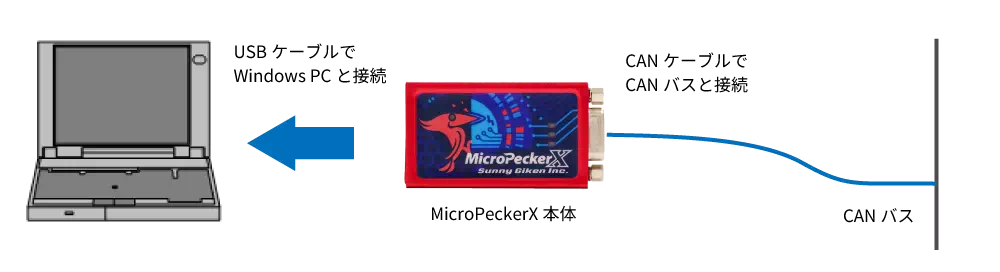
1. Connect devices
Connect MicroPeckerX.
Use the included USB cable to connect MicroPeckerX to a USB port on your Windows PC.
Also connect MicroPeckerX to the CAN bus.
- Incorrect wiring may damage both MicroPeckerX and the target device.
- If MicroPeckerX is used through a USB hub, PC power alone may be insufficient and operation may become unstable.
Use a self-powered USB hub.
2. Launch GUI
Start the GUI application as follows.
- Open Windows Start menu
- Expand
All apps->MicroPeckerX - Click
MicroPeckerX Control Software->MicroPeckerX Control Software Ver.X.XX(X.XX = product version)
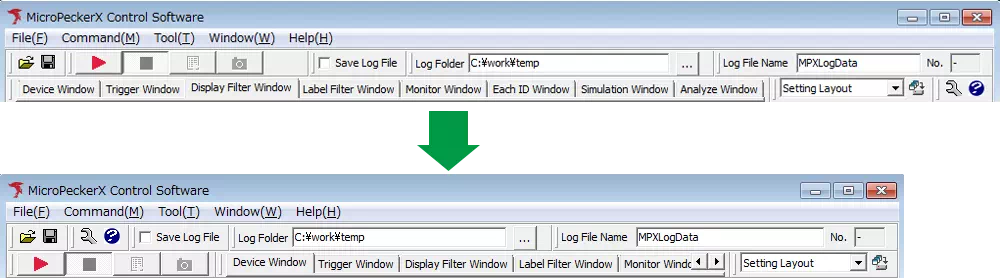
Toolbar
You can freely arrange the toolbar and each window layout. Adjust to your monitor size.
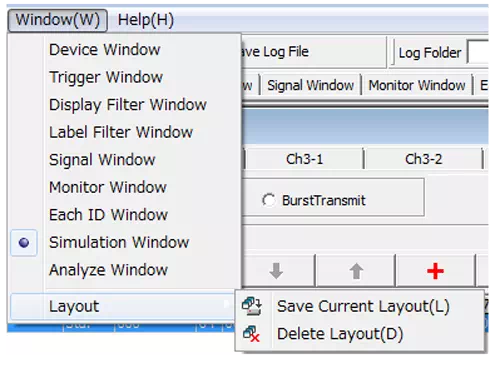
Save/switch window layouts
You can save window layouts with names and recall them any time.
- Layout names can be edited/deleted later.
- Pre-register frequently used layouts to improve efficiency.
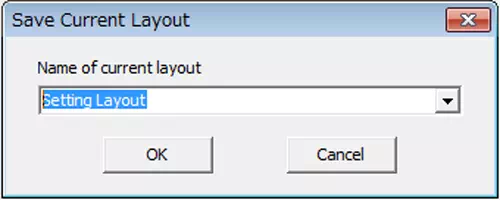
- Save layout
Window -> Layout -> Save Current Layout
- Name and save
Enter a layout name in the dialog and click Save.
- Recall saved layout
Select layout from layout dropdown. You can also save from the adjacent button.
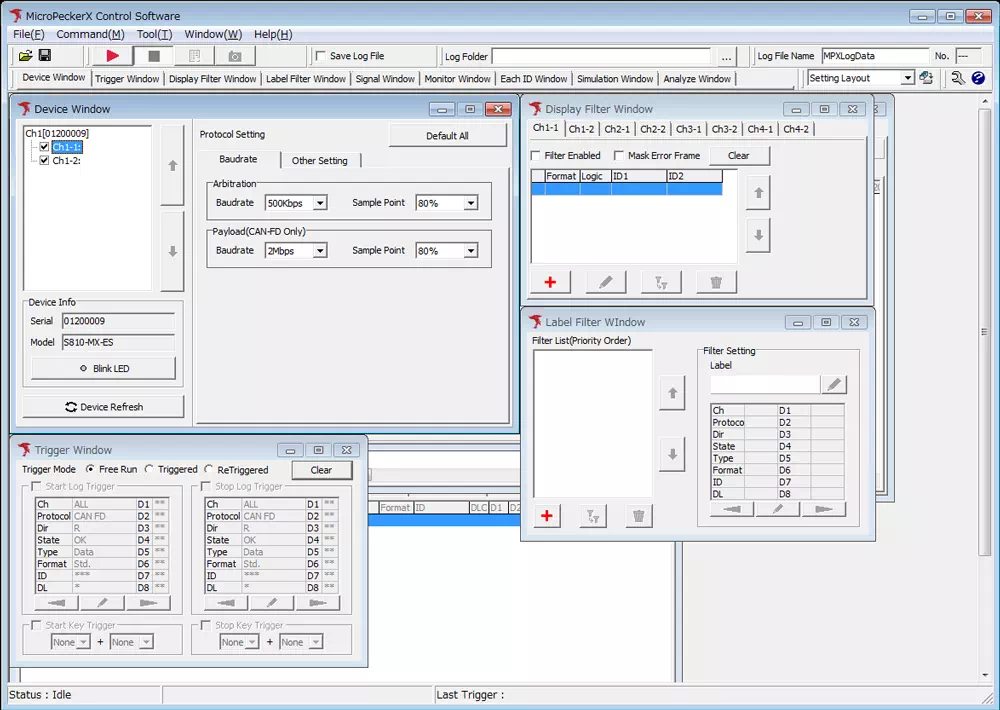
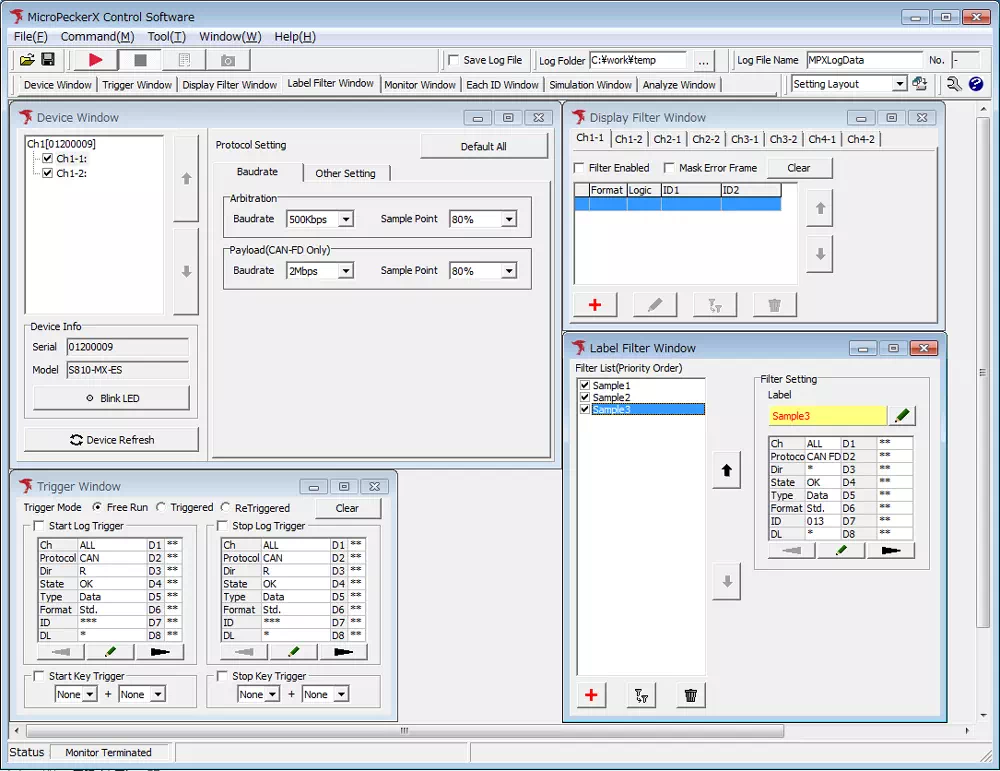
3. Configure communication
Configure communication settings for MicroPeckerX CAN FD Analyzer.
- Open Device Window from menu/toolbar.
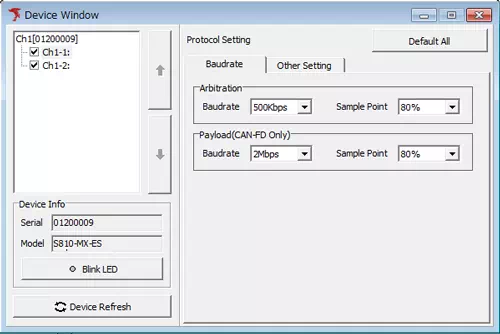
- Baud rate / sample point
- CAN: communication speed (e.g., 500 kbps)
- CAN FD: payload speed and sample point
- ACK response
- Enable/disable ACK response from MicroPeckerX
- Termination resistor
- Set bus termination ON/OFF
4. Configure display
Set label display to make communication results easier to read. Skip if unnecessary.
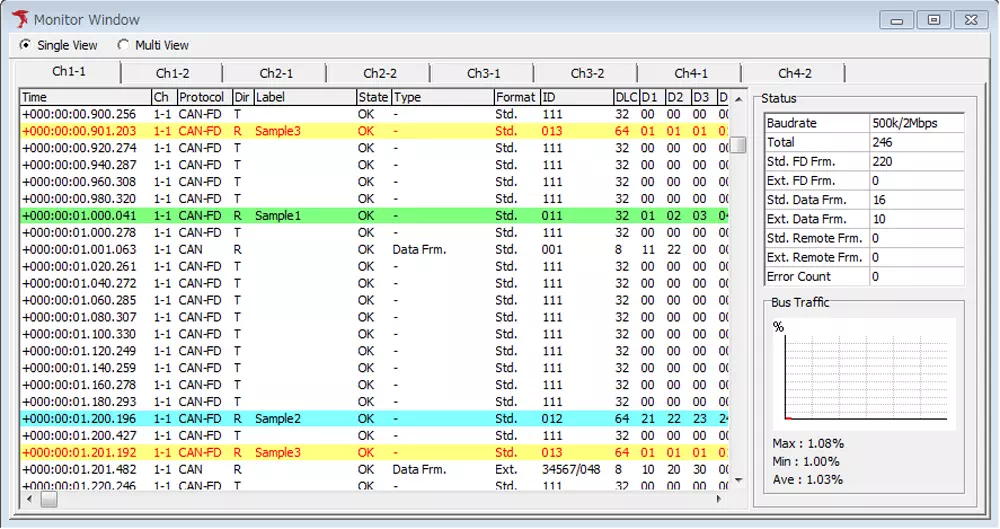
Label filter example
With label filters, label names and colors are applied for better visibility.
| Label target ID | Label name | Background color |
|---|---|---|
| 011 | Sample1 | green |
| 012 | Sample2 | blue |
| 013 | Sample3 | yellow |
Before label filter
After label filter
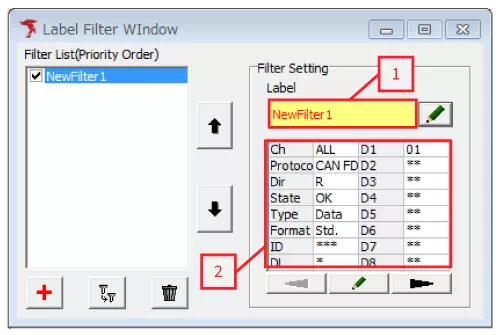
Label filter setup
- Open Label Filter Window from menu/toolbar.
-
Add filter with
+button. -
Configure label appearance
- Double-click label field [1] in Filter Setting, or click pencil icon
- Set font/background color in dialog
- Configure filter conditions
- Double-click condition field [2], or click pencil icon
- Set frame conditions and click OK
After this, colored labels are added to logs so target frames can be identified quickly.
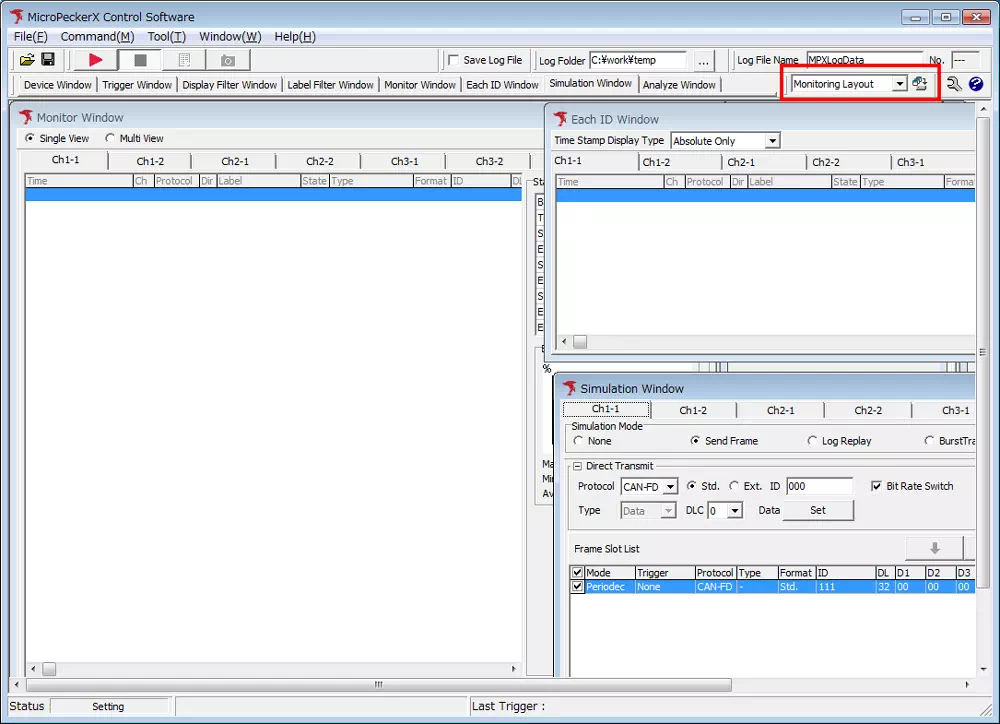
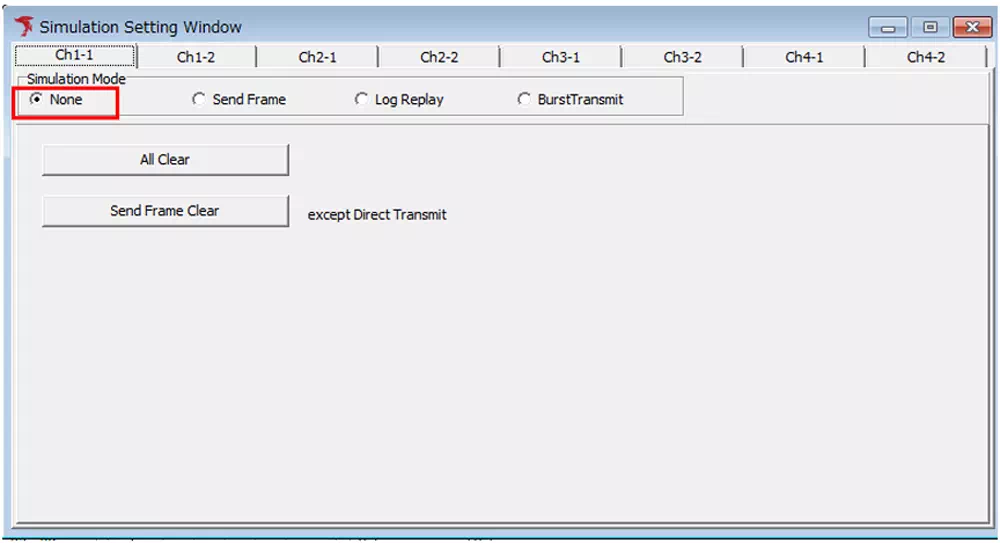
5. Select operation mode
Select operation mode of MicroPeckerX CAN FD Analyzer.
-
Open Simulation Window from menu/toolbar.
-
Select Simulation Mode
| Simulation Mode | Description |
|---|---|
| None | Monitor-only mode. No frame transmission. |
| Send Frame | Periodic transmission and event-based transmission can be configured. |
| Log Replay | Transmits frames based on prepared transmission logs. |
| BurstTransmit | Performs continuous high-load transmission on bus. |
For details, see the simulation section.
6. Start operation
Click toolbar ▶ to start operation.
When started, window layout automatically switches for monitoring logs.
Before start
During monitoring
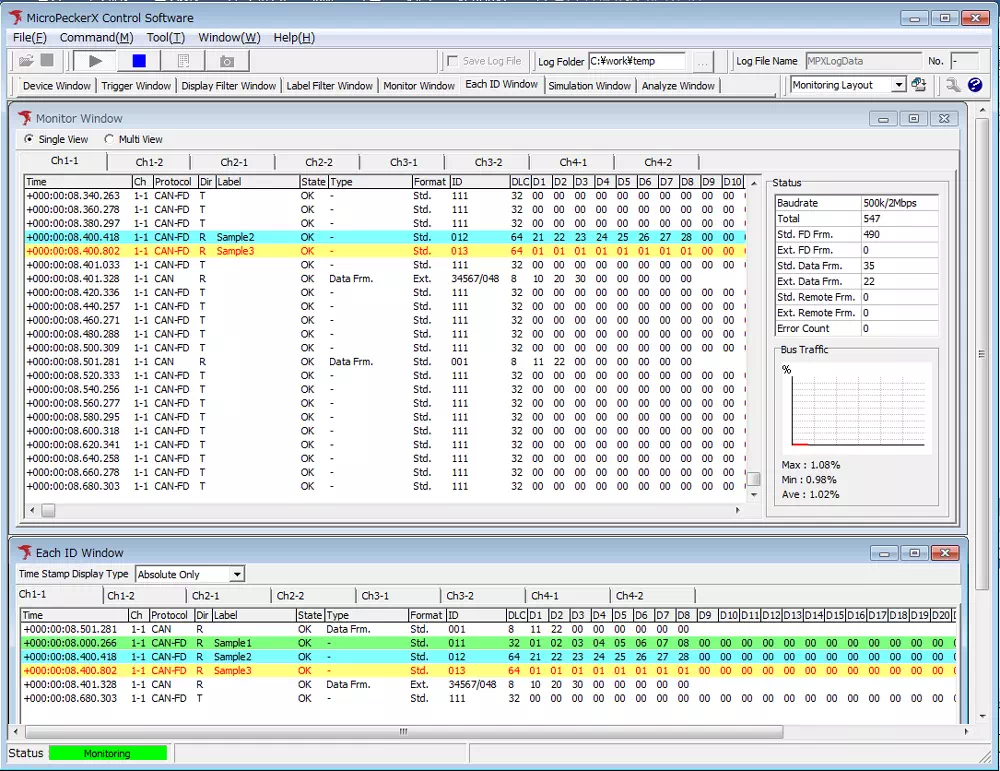
- Click ▶
- Layout switches and communication logs are displayed
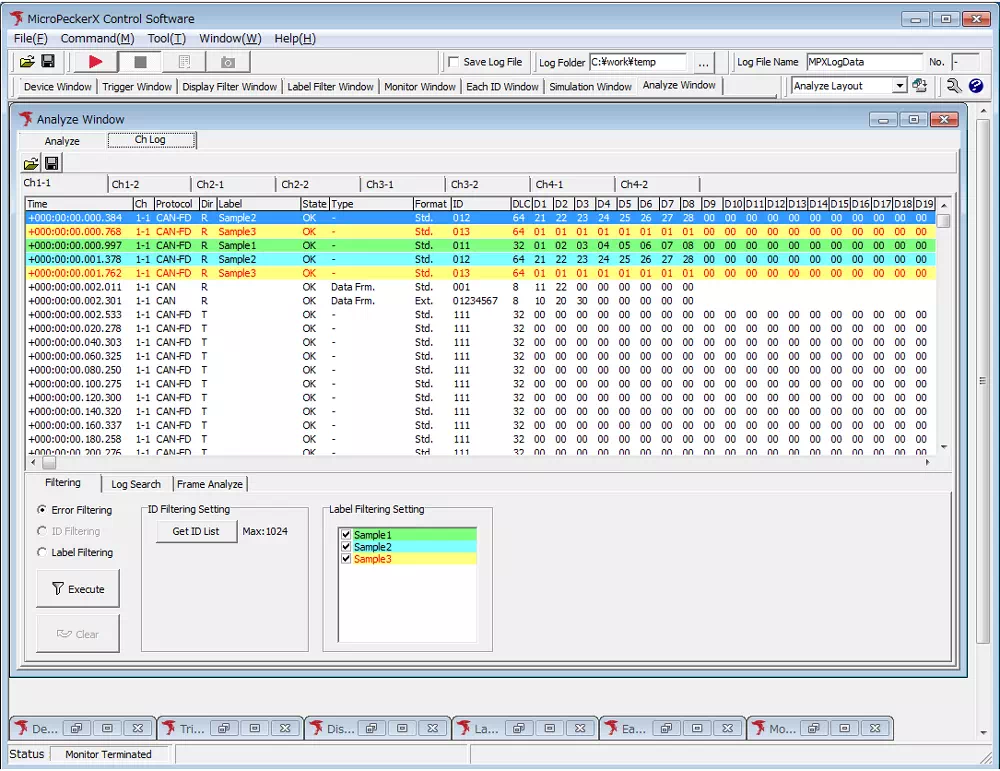
7. Stop operation
Click toolbar ■ to stop communication.
After stop, layout switches to log-review friendly view.
After stop
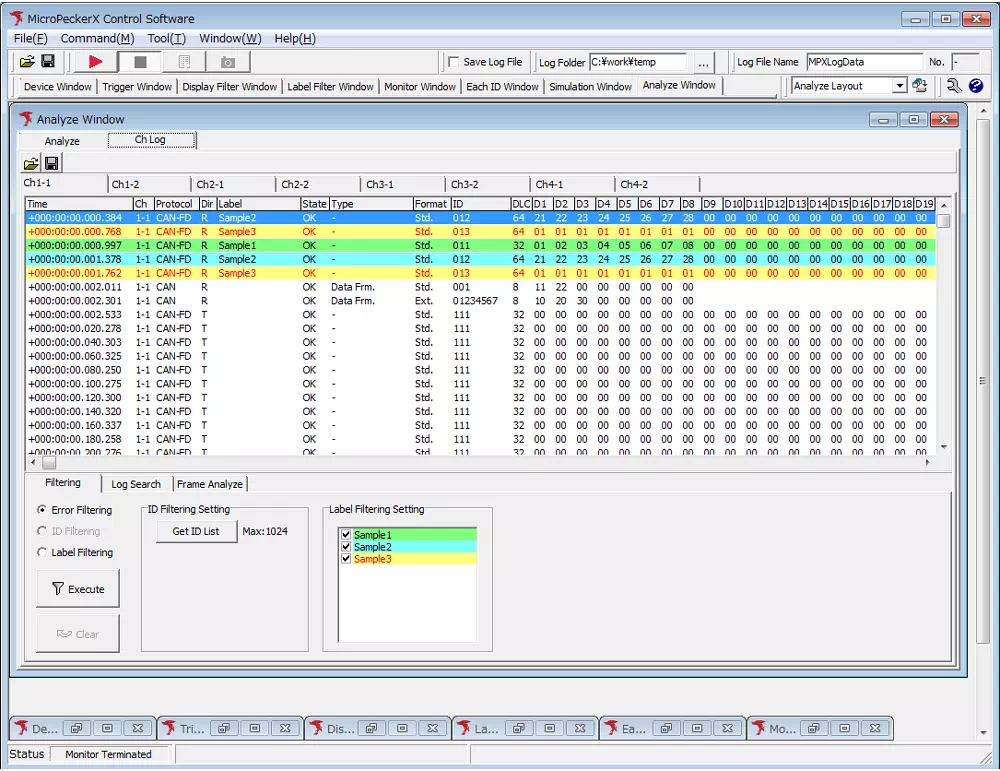
- Click ■
- Layout switches to log review view
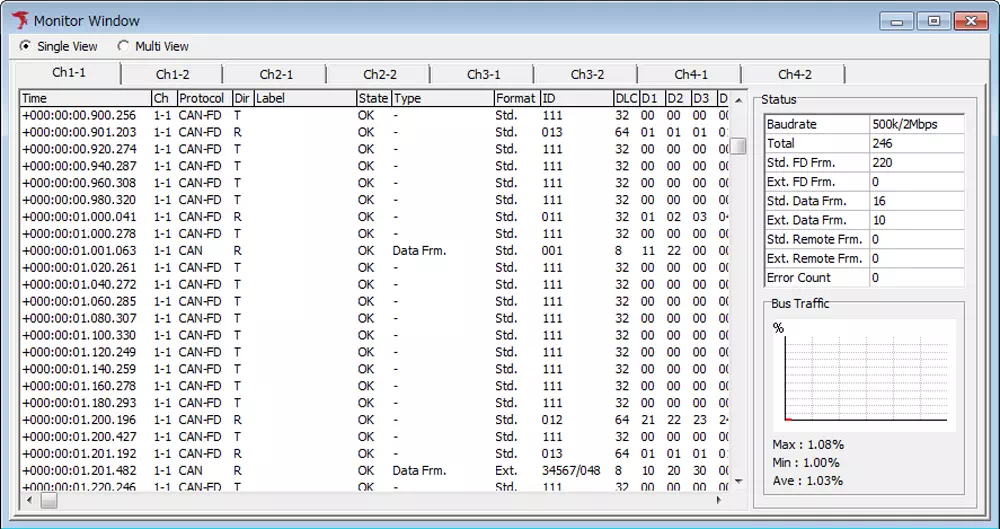
8. Check and analyze logs
After stopping, you can display and process recorded logs.
This section introduces search and offset functions.
Other analysis functions are also available:
- Frame Cycle Analyze: visualize/analyze frame transmission intervals
- CAN Gateway Latency: measure gateway delay and message loss
- CAN Gateway Residence: check peak gateway residence time
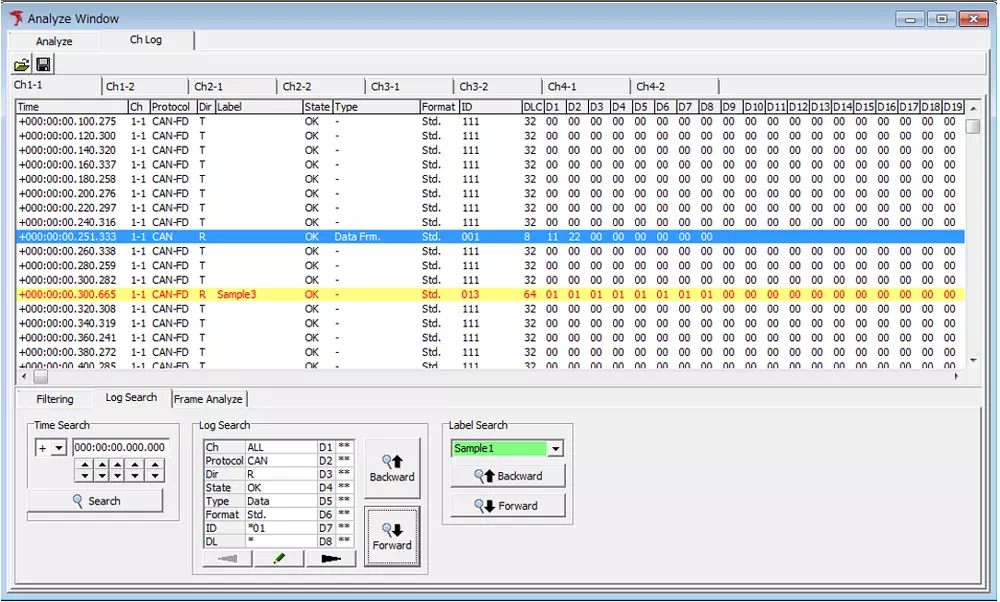
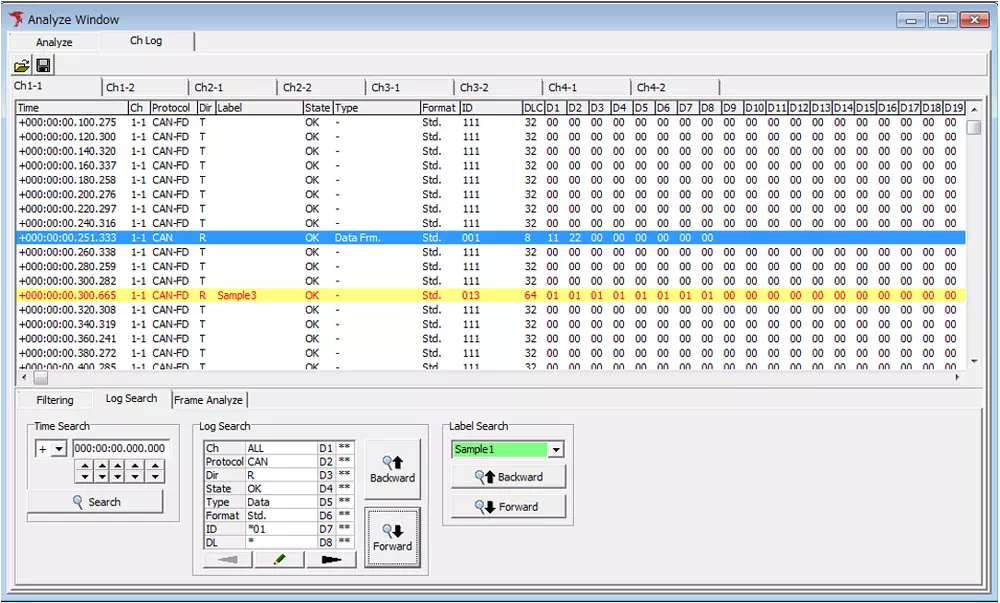
Search function
To find specific frames, specify IDs in the search box.
Partial match is supported. For example, searching *01 highlights frame 0x001.
- Open
Log Searchtab and click pencil button to open Log Search dialog - Enter
*01in ID field - Click OK
- Click
BackwardorForwardto select/highlight matched frames
Before search
After search
Offset function
Use offset function to confirm transmission intervals and relative time.
- Right-click the frame to use as reference
- Select
Set Offsetfrom context menu - Other frames are shown with relative time from reference timestamp
Before offset
After offset
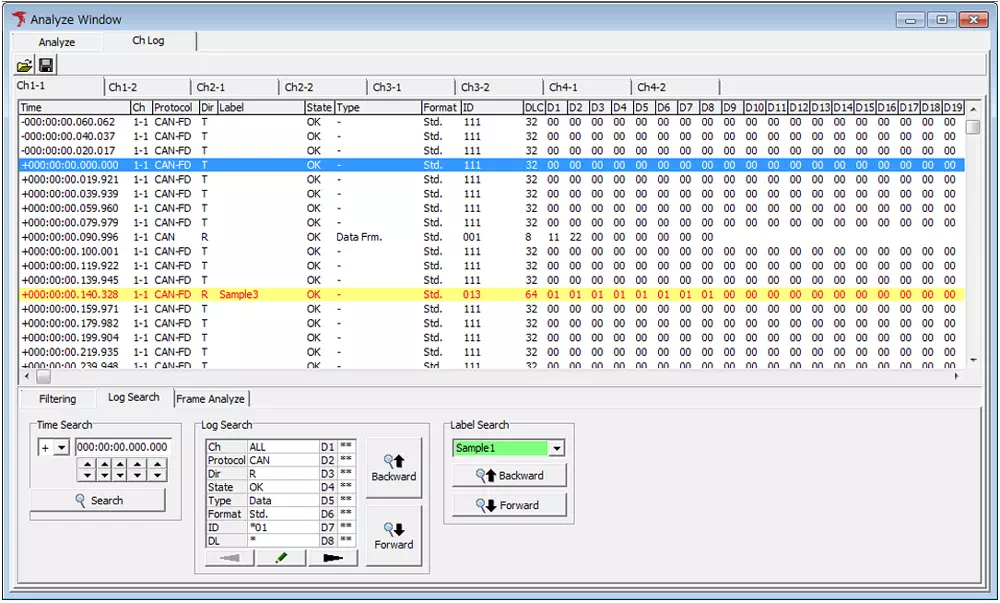
This allows intuitive understanding of inter-frame intervals with any frame as the reference point.