Frame Cycle Analysis
This feature examines time intervals between frames. Use Signal Analysis for changes in signal values over time, or alerts for missing signal reception notifications.
Frame cycle analysis measures intervals for specified CAN IDs in the log displayed in “Analyze Window.”
The following frame interval measurements are available.
- Maximum frame transmission interval
- Minimum frame transmission interval
- Average frame transmission interval
Frame cycle analysis is available under “CAN Frame Analyze” on the Ch Log tab in Analyze Window. The tab in the analysis results window is named “Frame Analyze.”
CAN Frame Analyze Tab Reference
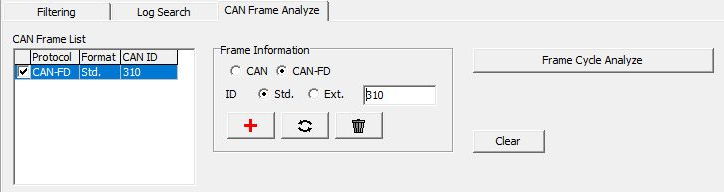
| Item | Description |
|---|---|
| CAN Frame List | Lists CAN IDs to analyze. Enable/disable analysis using each checkbox. |
| Frame Information | Registers CAN IDs to analyze. |
| CAN / CAN-FD | Selects the CAN/CAN FD frame type. |
| Std. / Ext. | Selects standard ID (Std.) or extended ID (Ext.). |
| CAN ID field | Enter the CAN ID (Hex). |
 | Registers the CAN ID configured in Frame Information in CAN Frame List. Up to 64 CAN IDs can be registered. |
 | Updates the CAN ID selected in CAN Frame List with the CAN ID configured in Frame Information. |
 | Deletes the CAN ID selected in CAN Frame List. |
| Frame Cycle Analyze button | Runs frame cycle analysis for the target CAN IDs in CAN Frame List and displays results. |
| Clear button | Deletes all target CAN IDs from CAN Frame List. |
CAN Frame Analyze Procedure
- Open the CAN Frame Analyze tab
Select “CAN Frame Analyze” in the “Ch Log” view.
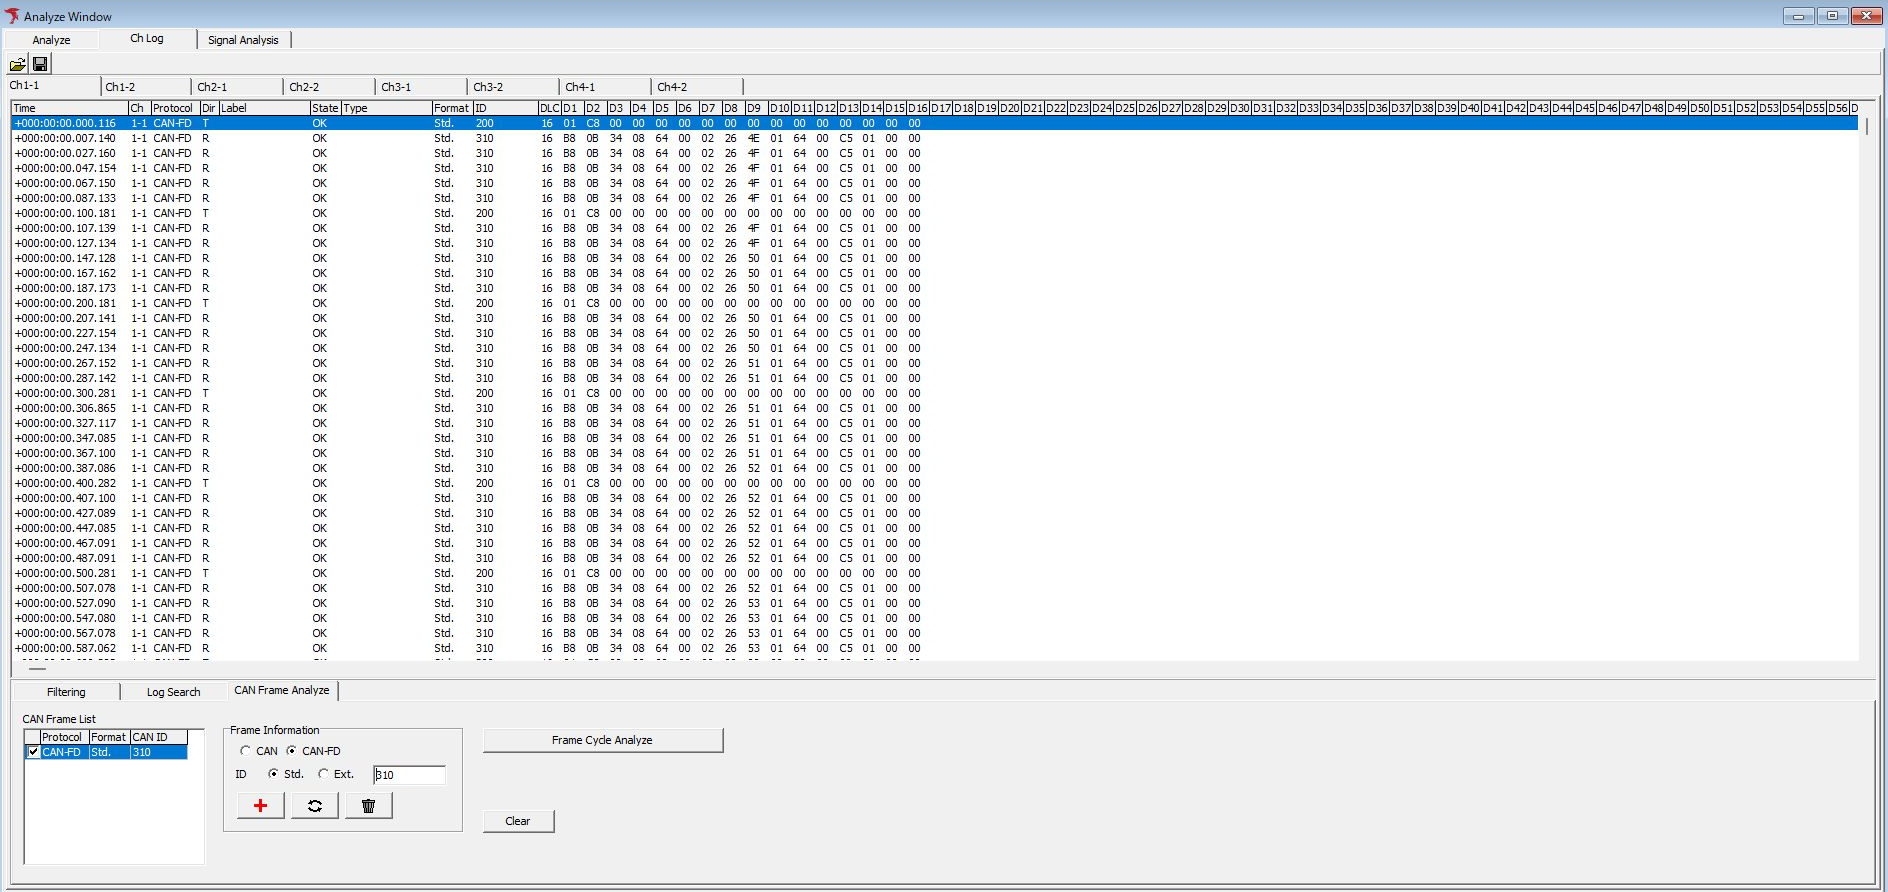
- Configure target CAN IDs
Configure the target CAN ID information in Frame Information.
Click the button to register the configured CAN ID in CAN Frame List.
- Run frame cycle analysis
Click “Frame Cycle Analyze” to display results in the “Analyze Result” window. See the following image and table for each item.
Frame Cycle Analysis Results Reference
This example shows measured results for CAN FD standard ID 0x310 on Ch 1-1. The average interval is 19.997 ms, maximum 20.268 ms, and minimum 19.725 ms.
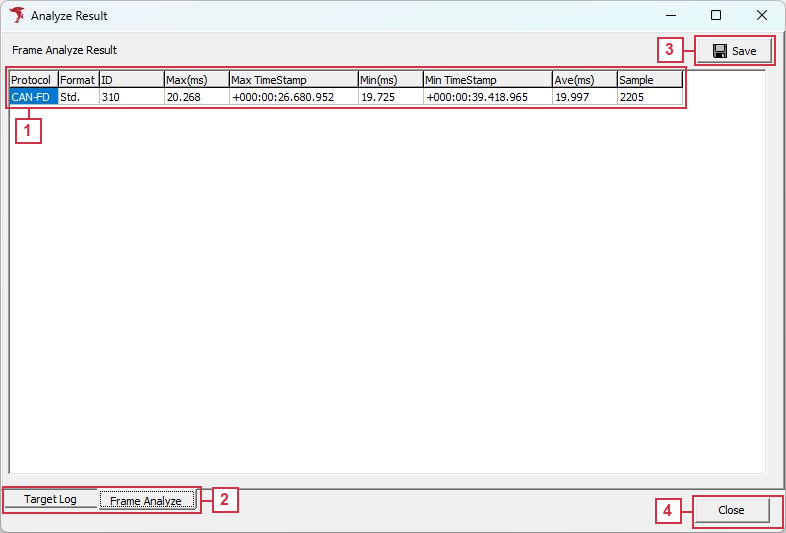
| No. | Item | Description |
|---|---|---|
| [1] | Protocol | Shows the CAN/CAN FD frame type; CAN-FD in this example. |
| Format | Shows standard ID (Std.) or extended ID (Ext.); Std. in this example. | |
| ID | Shows the CAN ID in hexadecimal. The displayed 310 means 0x310. | |
| Max(ms) | Shows the maximum frame interval; 20.268 ms in this example. | |
| Max TimeStamp (*) | Log timestamp where the maximum interval occurred; +000:00:26.680.952 in this example. | |
| Min(ms) | Shows the minimum frame interval; 19.725 ms in this example. | |
| Min TimeStamp (*) | Log timestamp where the minimum interval occurred; +000:00:39.418.965 in this example. | |
| Ave(ms) | Shows the average frame interval; 19.997 ms in this example. For Sample target frames, the calculation uses Sample−1 intervals. | |
| Sample | Number of analyzed frames with the same CAN ID. The example has 2,205 frames, so the average uses 2,204 intervals. | |
| [2] | Target Log tab | Shows the analyzed log. |
| Frame Analyze tab | Shows frame analysis results. | |
| [3] | Save button | Saves the displayed Frame Analyze Result contents as a CSV file. |
| [4] | Close button | Closes the Analyze Result window. |
*: Double-click a timestamp field to open the Target Log tab and display the corresponding log entry.