CAN gateway analysis specifications
CAN gateway delay/message loss analysis
Analysis specification overview
Measures the difference in timestamps from the gateway source Ch to the gateway destination Ch of the CAN frame specified as the gateway target, and obtains the maximum, minimum, and average values.
Additionally, if the corresponding frame is not output from the gateway channel even though the frame is output from the gateway source channel, it is determined that the message has been lost.
Setting information
The settings are as follows (multiple settings possible)
- Frame information (protocol/ID)
- Gateway information (Original Ch/Destination Ch)
Delay measurement
Example: FrameA, gateway source Ch1-1, gateway destination Ch2-1
Red arrows represent delays. In addition to the delay, we also measure the communication interval (blue arrow) at the gateway source and obtain the average.
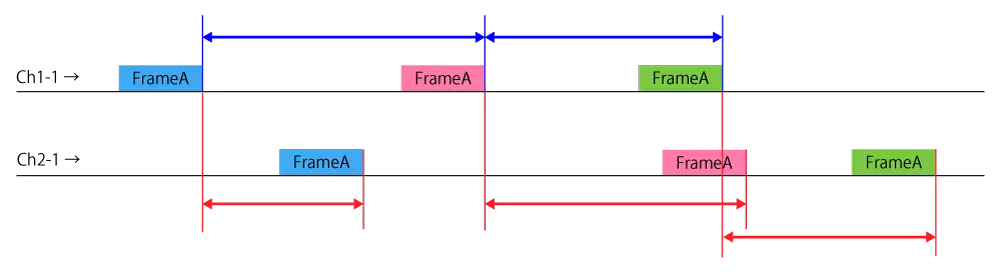
- The color of the frame indicates the difference in the transmitted data, and also takes into account the data difference (if the data length is different between the gateway source and the gateway destination, the shorter data length).
For example, if the gateway source DL is 8 and the gateway destination DL is 5, check if Data1 to Data5 match. - Logs detected at the gateway destination before the gateway source will not be analyzed.
- One set of gateway source and gateway destination is analyzed as one sample.
Message lost
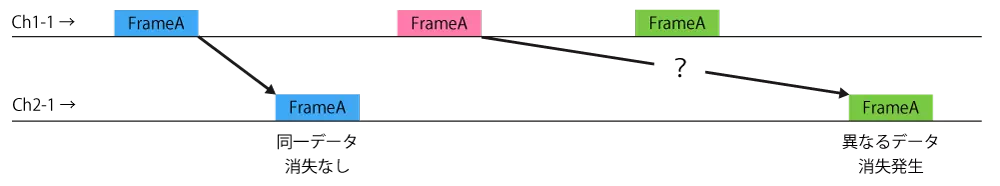
Example: FrameA, gateway source Ch1-1, gateway destination Ch2-1
If a loss occurs, the analysis of the delay and loss of the target frame will be interrupted at that point (the next target frame will be analyzed), but the analysis results up to that point will be output.
*: It will be NG if it is not from the gateway destination in the order of  .
.
A message will also be lost if the gateway destination frame is not detected for one frame and the information buffer of the gateway source frame reaches the maximum number (30).
Analysis results
The analysis results are as follows. (Number of target frames)
- Maximum delay (current timestamp)
- Minimum delay (current timestamp)
- average delay
- Average GW source reception cycle
- Maximum delay rate (maximum delay ÷ GW source reception cycle average)
- Message loss timestamp
- Number of samples
CAN gateway retention analysis
Analysis specification overview
Measure the difference in the number of occurrences of the gateway destination Ch from the gateway source Ch of the CAN frame specified as the gateway target and obtain the peak value.
It also obtains the peak value for each gateway channel.
Setting information
The settings are as follows (multiple settings possible)
- Frame information (protocol/ID)
- Gateway information (Original Ch/Destination Ch)
Retention number measurement
Example: FrameA, gateway source Ch1-1, gateway destination Ch2-1
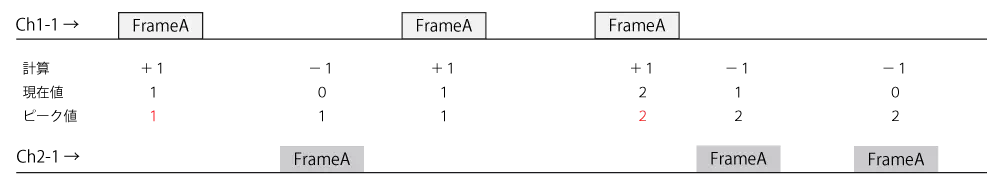
- Logs detected at the gateway destination before the gateway source (if the current value is negative) will not be analyzed.
- The number of samples is measured using the frame in which the peak value is added/subtracted.
Obtain peak value for each gateway channel
Obtain the peak value at the gateway destination channel of all target frames.
Example: Retention example for each Ch for Ch2-1
FrameA, gateway source Ch1-1, gateway destination Ch2-1
FrameB, gateway source Ch3-1, gateway destination Ch2-1
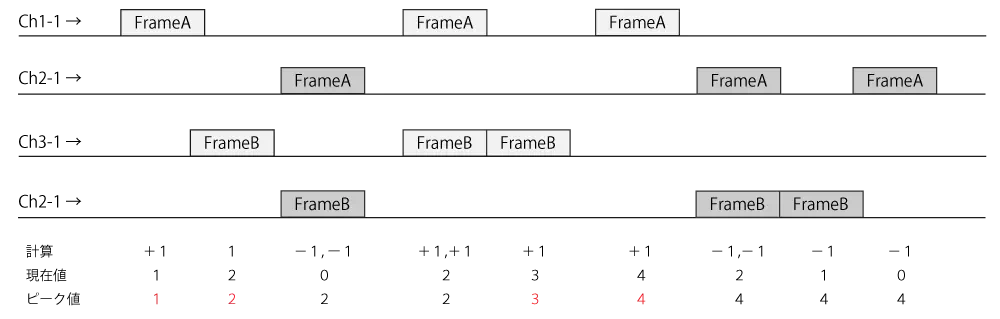
- Logs detected at the gateway destination before the gateway source (if the current value is negative) will not be analyzed.
- The number of samples is measured using the frame in which the peak value is added/subtracted.
Analysis results
The analysis results are as follows.
Analysis results for each gateway channel
- Peak value (time stamp at that time)
- Number of samples
Analysis results of target frames (number of target frames)
- Peak value (time stamp at that time)
- Number of samples