CAN GW Analysis Function
When multi-channel log integration is used, GW Analyze becomes available.
GW Analyze provides the following CAN gateway analysis functions:
- Gateway latency analysis (GW Latency Analyze)
- Message loss analysis (Msg. Lost Analyze)
- Gateway residence analysis (GW Msg. Residence Peak Analyze)
GW Analyze Tab Display
| No. | Item | Description |
|---|---|---|
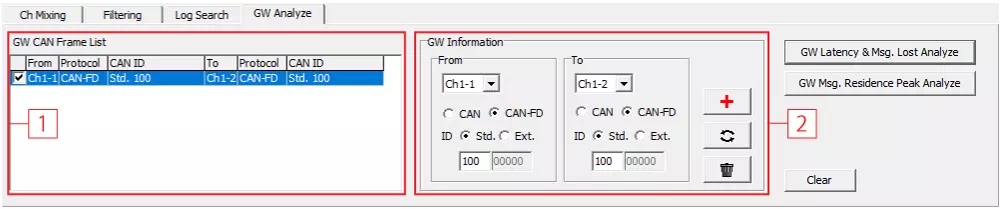
| [1] | GW CAN Frame List | Displays list of frames to analyze. Analysis can be enabled/disabled with checkboxes. |
| [2] | GW Information | Registers frames for analysis. |
| From | Sets source channel of GW. | |
| To | Sets destination channel of GW. | |
| Ch dropdown | Sets target channel to analyze. | |
| CAN / CAN-FD | Selects CAN/CAN FD frame type. | |
| Std. / Ext. | Selects standard ID (Std.) / extended ID (Ext.). | |
| CAN ID input | Inputs CAN ID (Hex). | |
 | Registers GW frame configured in GW Information to GW CAN Frame List. Up to 64 frames can be registered. | |
 | Updates selected GW CAN Frame List frame with settings in GW Information. | |
 | Deletes selected frame from GW CAN Frame List. | |
| - | GW Latency & Msg. Lost Analyze button | Executes gateway latency and message loss analysis and displays result. |
| - | GW Msg. Residence Peak Analyze button | Executes gateway residence analysis and displays result. |
| - | Clear button | Deletes all target frames from GW CAN Frame List. |
GW Analyze Setup Procedure
- Open GW Analyze tab
Select GW Analyze tab in Analyze view.
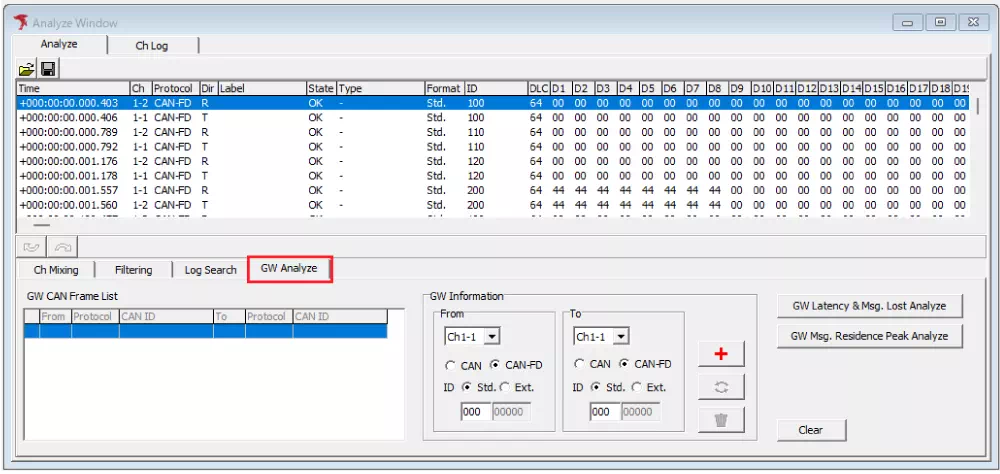
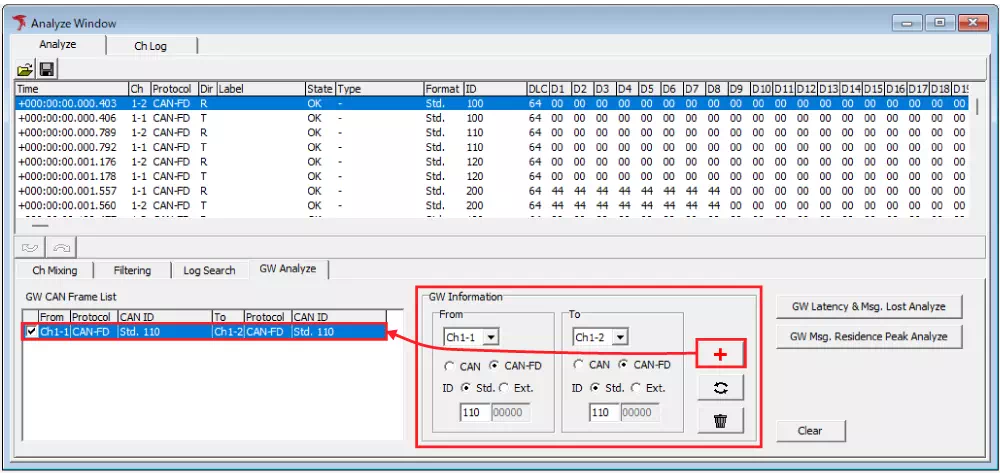
- Set target frames for analysis
Set frame information in GW Information.
Set source CAN ID inFromand destination CAN ID inTo.
Click to register the frame in GW CAN Frame List.
- Execute gateway latency/message loss analysis
ClickGW Latency & Msg. Lost Analyzeto open Analyze Result window and display analysis results.
- Execute gateway residence analysis
ClickGW Msg. Residence Peak Analyzeto open Analyze Result window and display analysis results.
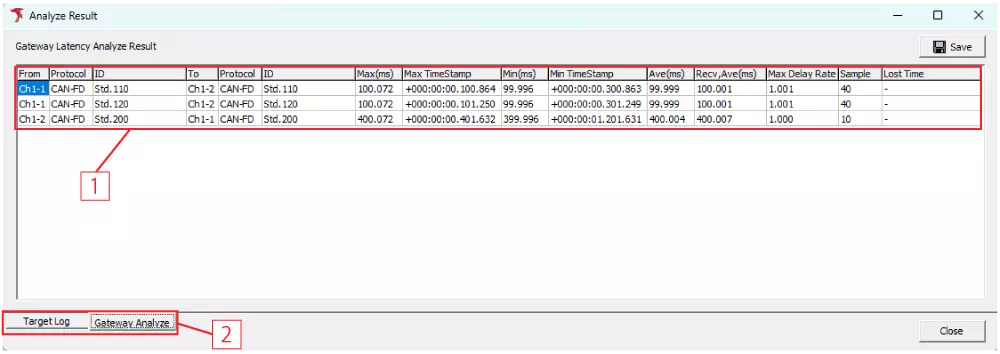
Gateway Latency / Message Loss Analysis Screen Description
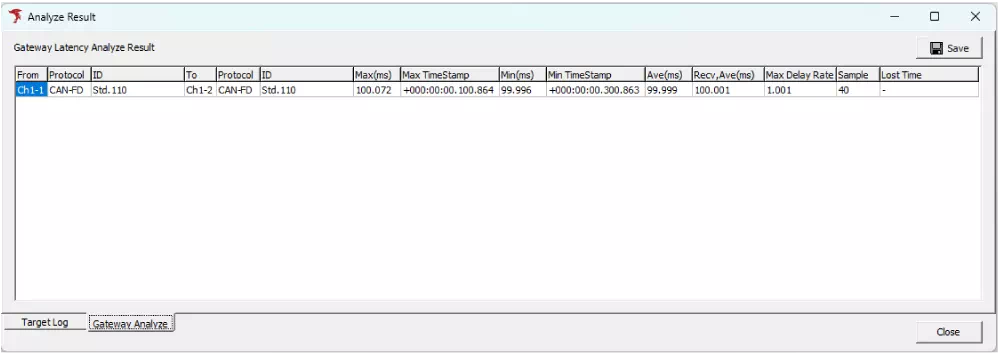
When GW Latency & Msg. Lost Analyze is executed, analysis results are shown in Analyze Result.
| No. | Item | Description |
|---|---|---|
| [1] | From | Displays GW source channel. |
| Protocol | Displays frame type (CAN/CAN FD) at GW source. | |
| ID | Displays standard/extended ID and CAN ID at GW source. | |
| To | Displays GW destination channel. | |
| Protocol | Displays frame type (CAN/CAN FD) at GW destination. | |
| ID | Displays standard/extended ID and CAN ID at GW destination. | |
| Max(ms) | Displays maximum latency. | |
| Max TimeStamp (note1) | Displays timestamp where maximum latency occurred. | |
| Min(ms) | Displays minimum latency. | |
| Min TimeStamp (note1) | Displays timestamp where minimum latency occurred. | |
| Ave(ms) | Displays average latency. | |
| Recv.Ave(ms) | Displays average GW receive cycle. | |
| Max Delay Rate | Displays maximum delay rate (max latency / average GW receive cycle) (note2). | |
| Sample | Displays sample count of same CAN ID. | |
| Lost Time (note1) | Displays first timestamp where message loss occurred. | |
| [2] | Target Log tab | Displays logs to analyze. |
| Gateway Analyze tab | Displays analysis result. | |
| - | Save button | Saves displayed Gateway Latency Analyze Result as CSV. |
| - | Close button | Closes Analyze Result window. |
note1: Double-clicking a timestamp item opens Target Log tab and shows corresponding log.
note2: If loss occurs, latency result values (Max/Min/Ave/Recv.Ave/Max Delay Rate/Sample) are calculated from data up to first loss occurrence.
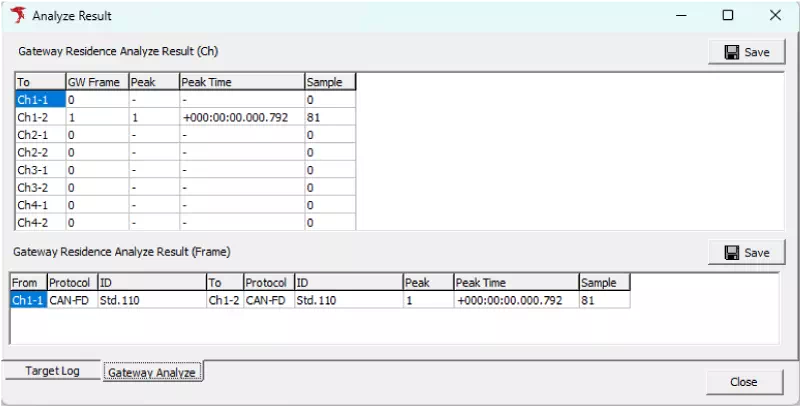
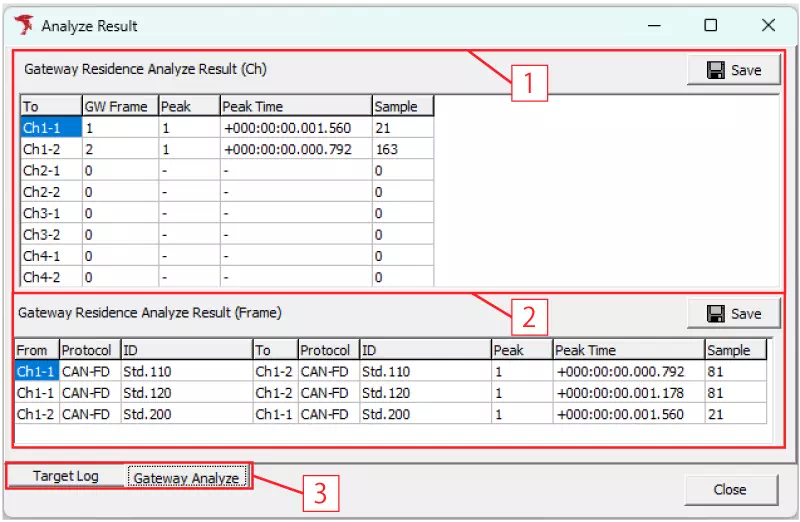
Gateway Residence Analysis Screen Description
When GW Msg. Residence Peak Analyze is executed, analysis results are shown in Analyze Result.
| No. | Item | Description |
|---|---|---|
| [1] | Gateway Residence Analyze Result(Ch) | Displays gateway residence analysis results per channel. |
| To | Displays GW destination channel. | |
| GW Frame | Displays number of GW target frames. | |
| Peak | Displays maximum retained frame count. | |
| Peak Time (note) | Displays timestamp where peak occurred. | |
| Sample | Displays sample count of GW frames. | |
| Save button | Saves Ch Result display as CSV. | |
| [2] | Gateway Residence Analyze Result(Frame) | Displays gateway residence analysis result per GW frame. |
| From | Displays GW source channel. | |
| Protocol | Displays frame type at GW source. | |
| ID | Displays standard/extended ID and CAN ID at GW source. | |
| To | Displays GW destination channel. | |
| Protocol | Displays frame type at GW destination. | |
| ID | Displays standard/extended ID and CAN ID at GW destination. | |
| Peak | Displays maximum retained frame count. | |
| Peak Time (note) | Displays timestamp where peak occurred. | |
| Sample | Displays sample count of same CAN ID. | |
| Save button | Saves Frame Result display as CSV. | |
| [3] | Target Log tab | Displays logs to analyze. |
| Gateway Analyze tab | Displays analysis result. | |
| - | Close button | Closes Analyze Result window. |