Function Overview and Basic Operations
Function Overview
The data analysis function of MicroPeckerX CAN FD Analyzer allows you to analyze and visualize acquired log data from various angles. Main features are as follows.
| Feature | Description |
|---|---|
| Integrated log analysis (Analyze tab) | Merge logs from multiple channels and analyze on one timeline. - Multi-channel log merge (Ch Mixing) - Filter display (Error/ID/Label) - Log search (time/trigger/label) - Time offset set/clear - CAN GW analysis (delay, loss, retention) - Undo/Redo (up to 5 steps) - Log load/save buttons |
| Per-channel log analysis (Ch Log tab) | Analyze each channel independently. - Filter display (Error/ID/Label) - Log search (time/trigger/label) - Time offset set/clear - Frame cycle measurement (Frame Analyze) - Log load/save buttons |
| GW analysis | Measures frame delay, message loss, and retention peak via CAN-Gateway. |
| Frame cycle analysis | Measures transmission interval of specified frames and displays max/min/average/sample count. Results can be saved as CSV. |
| Advanced filter/search | Detailed filtering and search by Error/ID/Label and other conditions. |
| Log load/save | Import/export log files in Analyze Window and Ch Log tabs. |
| Undo/Redo | Undo/redo filter and merge operations up to 5 steps. |
These functions support efficient multi-angle analysis of large on-site logs for quick problem identification and performance evaluation.
Basic Operation
1. Start communication monitoring
Select Command -> Start in menu bar to start logging.
Note: At start, GUI layout switches automatically to Monitoring Layout.
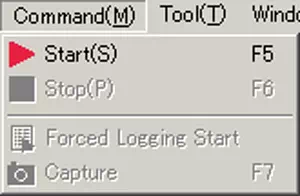
You can also start by toolbar  or
or F5.
2. Stop communication monitoring
Select Command -> Stop to stop monitoring.
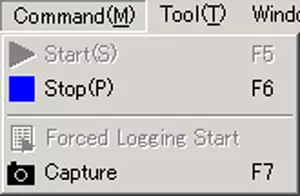
You can also stop by toolbar  ,
, F6, or Esc.
Note: Depending on Option settings, layout may switch automatically to Analyze Layout.
3. Display Analyze Window
With default settings, Analyze Window opens automatically after monitoring stops.
Analyze Window Screen Description
You can analyze acquired log data in Analyze Window.
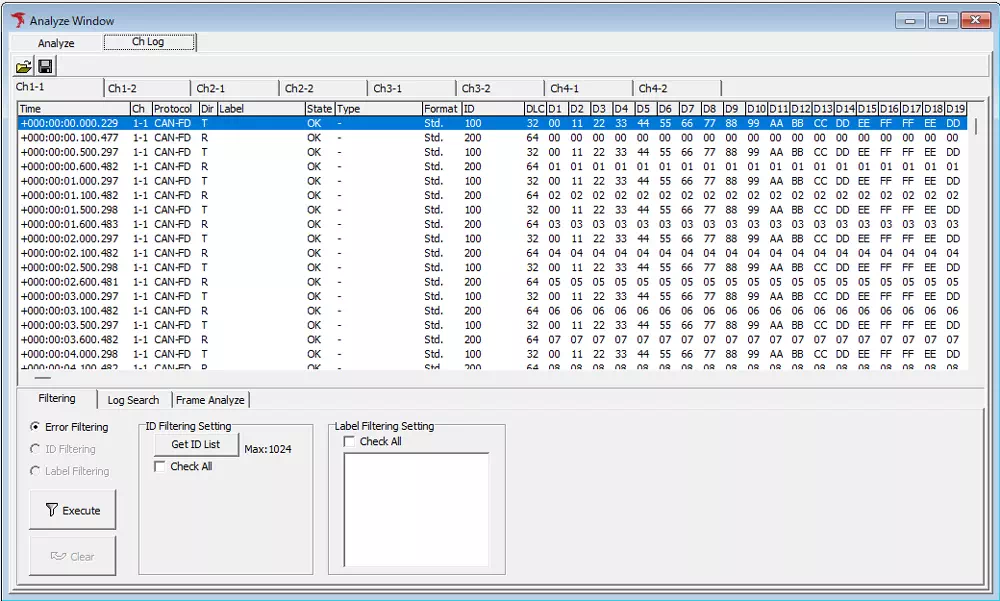
Ch Log tab display
| No | Item | Description |
|---|---|---|
| [1] | Analyze tab | Merges and analyzes logs from each channel. |
| Ch Log tab | Analyzes logs per channel. | |
| [2] |  button button | Loads and displays log files. |
 button button | Saves logs currently shown in the tab. | |
| [3] | Channel tab | Switches displayed bus channel according to connected MicroPeckerX. Up to 8 channels can be switched. |
| [4] | Filtering tab | Configures/displays filtering by Error/ID/Label. |
| Log Search tab | Configures/displays search by time/trigger/label. | |
| Frame Analyze tab | Configures/displays frame cycle measurement. |
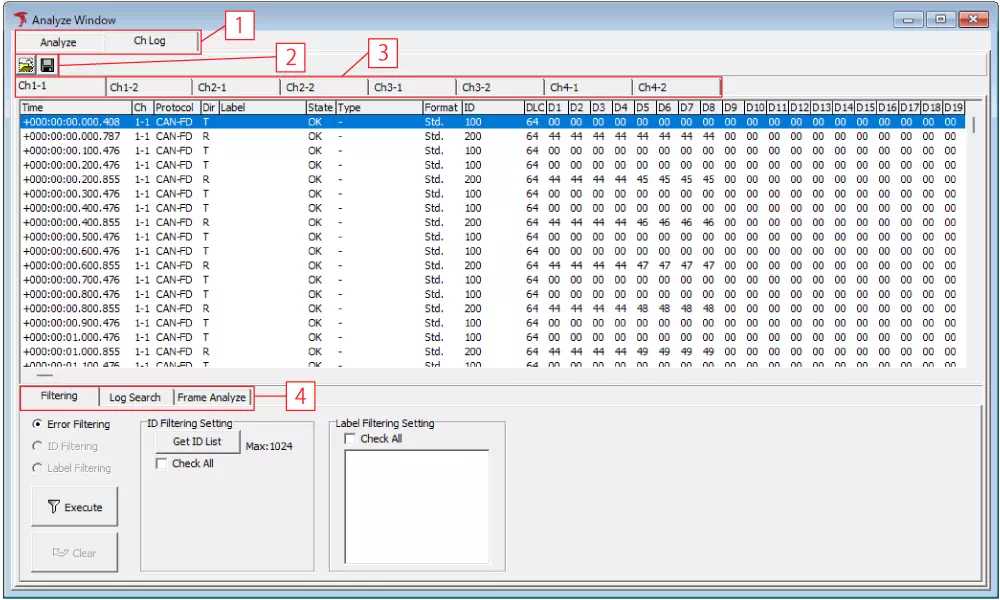
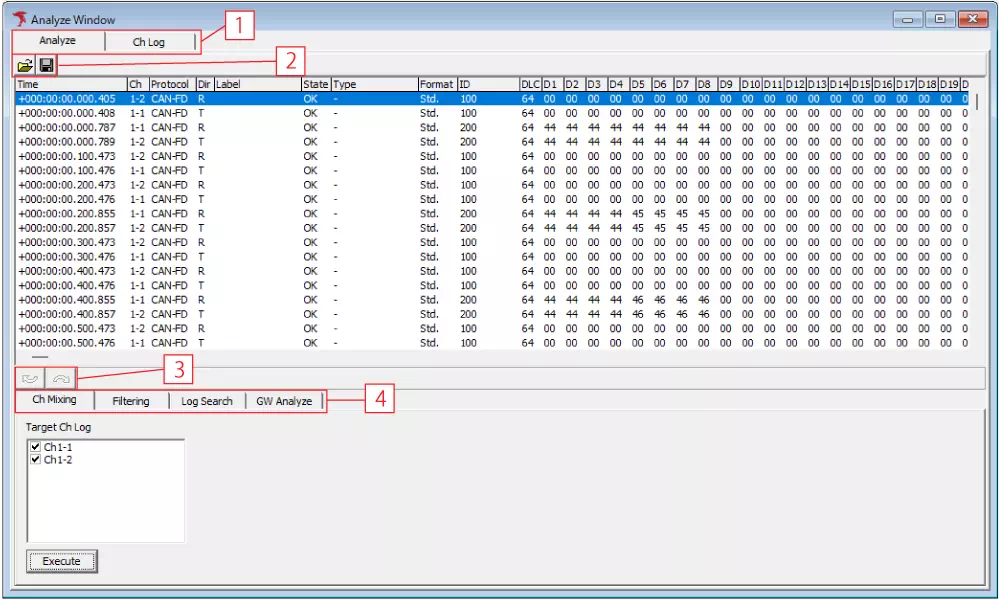
Analyze tab display
| No | Item | Description |
|---|---|---|
| [1] | Analyze tab | Merges and analyzes logs from each channel. |
| Ch Log tab | Analyzes logs per channel. | |
| [2] | button | Loads and displays log files. |
| button | Saves logs currently shown in the tab. | |
| [3] |  button button | Undo previous operation (up to 5 steps). |
 button button | Redo canceled operation (up to 5 steps). | |
| [4] | Ch Mixing tab | Configures/displays merge settings for selected channels. |
| Filtering tab (note) | Configures/displays filtering by Error/ID/Label. | |
| Log Search tab (note) | Configures/displays search by time/trigger/label. | |
| GW Analyze tab (note) | Configures/displays GW frame analysis. |
*: Tabs are shown after executing Ch Mixing.