Recording and Exporting Signal Analysis Results
Choosing What to Save
| Content to retain | Operation / format |
|---|---|
| Original communication data | Save logs from monitoring/Analyze. Also manage the version of the signal definitions. |
| Signal definitions, Signal Sets, display settings | Save MPXSIG using Save in Signal Catalog or equivalent operations. Communication logs and all analyzed sample values are not included. |
| Analyzed signal values | Export CSV in Signal Analysis. Select the output range, signals, and additional information. |
| Graph appearance | Save Graph Area or Copy Graph Area under More Graph commands. This captures the selected Area. |
| Annotations / investigation notes | Record required times, titles, and comments separately. Annotations are retained within the log session. |
Exporting Signal Values to CSV
- Run analysis and wait for it to finish with the latest conditions. Then open “Export CSV.”
- Select the output range in “Export Signal CSV.” Check how many signals have samples in this range.
- Check the signals to export in the signal tree. Read the
selectedcount, then theexportablecount. The exportable count is the number of selected signals with samples in the range. At zero, “Save CSV...” is disabled. - Choose the output options and check the preview. Use “Save CSV...” to specify the destination.
Figure 1 uses the completed Fan Demo - CAN FD RPM analysis of FD2FanDemo_1-1.csv. Entire analysis spans +000:00:00.000.101–+000:01:58.640.758. Both RPM signals have samples (2 / 2); only Simulated_RPM_demo is checked, so selected and exportable are both 1. Value changes only is ON by default; RawValue and source bytes are OFF.
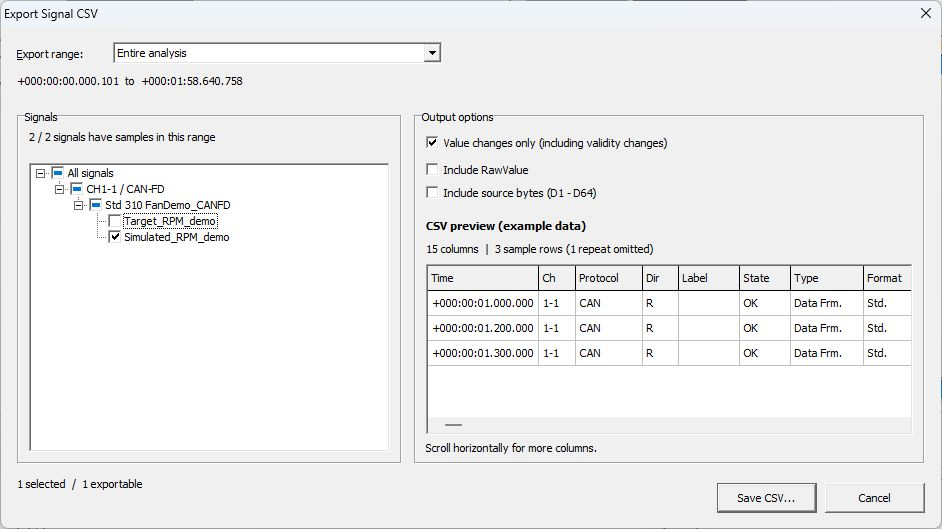
Figure 1. Normal CSV export settings. The right-hand preview uses fictional data.
| Item | Description |
|---|---|
| Entire analysis | Includes the entire analyzed range. |
| Current graph range | Includes the current graph display range. Check the selected Graph/Area first. |
| Selected trigger interval | Includes the selected trigger interval when available. |
| Tree under All signals | Selects signals to export from a hierarchy of channels, protocols, frames, and other items. [Outside this range] identifies signals with no samples in the selected range. [No analysis data] identifies signals with no samples in the entire analysis. |
| Value changes only (including validity changes) | On by default in Ver.4.10. Exports the first sample for each signal and samples where the value or valid/invalid state changed. Turn it off to export every sample. |
| Include RawValue | Adds a RawValue column. Derived signals have no Raw value as an original bus signal. |
| Include source bytes (D1 - D64) | Adds source frame data columns. |
Keep the same signals checked and switch from “Entire analysis” to “Current graph range” to compare the counts. Signals whose samples are outside the displayed range drop out of the counts of signals with samples and exportable signals. The selected count stays the same.
“CSV preview (example data)” uses the fictional signal ExampleSpeed to show the output format. Toggle “Include RawValue” and “Include source bytes (D1 - D64),” then scroll horizontally to check the RawValue and D1–D64 columns. With “Value changes only (including validity changes)” on, the preview omits one of the four sample rows because its value and validity match the preceding row. Open the saved CSV to inspect the exported rows.
The CSV contains source frame information such as Time, Ch, Protocol, and ID, plus Signal, Value, Unit, SignalStatus, and DisplayText. For multiple signals, a separate row is output per signal for the same source frame. Check value validity together with SignalStatus.
This CSV exports analyzed signal values for inspection in spreadsheet software and similar tools. Do not keep it instead of the original communication log or use it as a transmission log for Log Replay.
Checking the CSV Preview
Figures 2–4 show excerpts of the output options and preview. They use the fictional ExampleSpeed data built into the dialog, rather than the actual RPM signal values or an exported CSV. The preview's CAN frames do not change to match the CAN-FD log being analyzed.
| Options | Preview columns / sample rows |
|---|---|
| RawValue OFF, source bytes OFF, Value changes only ON (Figure 1) | 15 columns / 3 rows (1 repeat omitted) |
| RawValue ON, source bytes OFF, Value changes only ON (Figure 2) | 16 columns / 3 rows |
| RawValue ON, source bytes ON, Value changes only ON (Figure 3) | 80 columns / 3 rows |
| RawValue ON, source bytes ON, Value changes only OFF (Figure 4) | 80 columns / 4 rows (includes 1 repeat) |
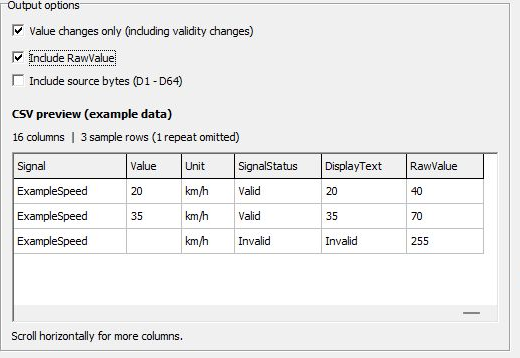
Figure 2. Adding RawValue. The Invalid row has an empty Value and RawValue 255.
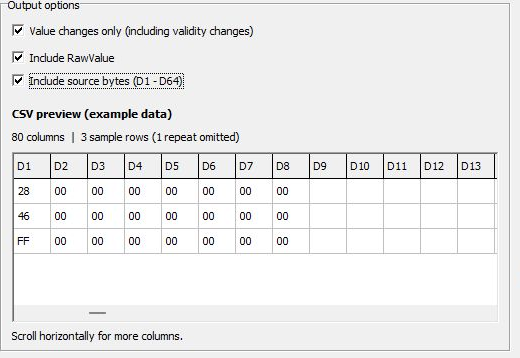
Figure 3. Adding D1–D64; scroll horizontally to inspect source-byte columns.
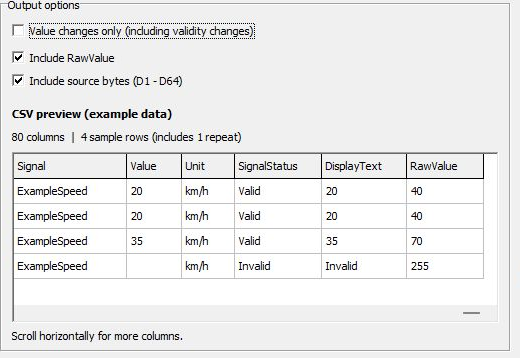
Figure 4. Keeping the repeated row. With Value changes only ON, this row is omitted while validity changes remain.
Example: Exporting Actual Rotational Speed for a Trigger Interval
Figure 5 uses a Ver.4.10 analysis of “Source: Monitor buffer” with trigger information retained. It selects the first of two trigger intervals with the Fan Demo - CAN FD RPM Set. This recording differs from both the saved log in Figure 1 and the signal trigger recording example.
- Before opening the CSV dialog, click inside the first trigger interval on the graph. This example uses a point at about 20 seconds.
- Open “Export CSV,” choose “Selected trigger interval,” and check the start and end times. If a different interval is shown, close the dialog and select the intended interval on the graph.
- In the signal tree, select only “CH1-1 / CAN-FD” → “Std 310” → “Simulated_RPM_demo.” Figure 5 shows 2 / 2 signals with samples, 1 selected, and 1 exportable.
- Turn off “Value changes only (including validity changes),” “Include RawValue,” and “Include source bytes (D1 - D64),” then save using “Save CSV...”. Value changes only is ON by default; turn it OFF to export every sample.
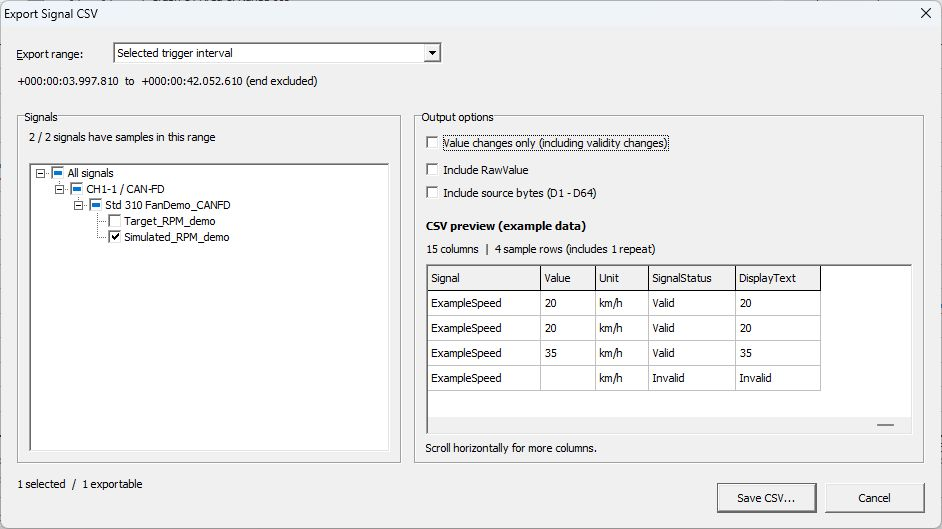
Figure 5. CSV settings for the first trigger interval. The four rows on the right are the fictional ExampleSpeed preview.
The interval starts at +000:00:03.997.810 and ends at +000:00:42.052.610, a duration of 38.054800 s. Signal-value CSV includes samples at or after the start and before the end. This example uses Monitor buffer with interval information retained; opening a communication log CSV on its own may not restore the same interval selection.
The saved CSV has 15 columns and 1,903 data rows, excluding the file metadata and column header. Every row is CH1-1, CAN-FD, ID 310, Simulated_RPM_demo, with SignalStatus Valid. The table below excerpts the time, value, and status from the first three and last three rows.
| Data row in actual CSV | Time | Value (rpm) | SignalStatus |
|---|---|---|---|
| 1 | +000:00:03.997.810 | 1501 | Valid |
| 2 | +000:00:04.017.811 | 1504 | Valid |
| 3 | +000:00:04.037.814 | 1507 | Valid |
| … | … | … | … |
| 1,901 | +000:00:41.992.607 | 1025 | Valid |
| 1,902 | +000:00:42.012.616 | 1016 | Valid |
| 1,903 | +000:00:42.032.623 | 1008 | Valid |
All 1,903 rows are in increasing time order, at or after the interval start and before its end. No row has the end time +000:00:42.052.610. There are also 352 rows whose Value and SignalStatus match the preceding row. With Value changes only OFF, these repeated samples remain. Distinguish the four fictional preview rows in Figure 5 from the 1,903 rows actually exported.
Saving Graphs as Images
Set the target Graph/Area, time range, axes, legend, and other display details, then select “Save Graph Area” under More Graph commands. Available formats are BMP, JPEG, and WMF. “Copy Graph Area” copies the selected Area to the clipboard.
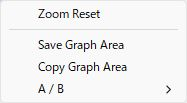
Figure 6. Controls for saving/copying the selected Area as an image.
Include the log name, definition version, signal names, time range, and units with an image to help verify conditions later. An image alone cannot be used to reanalyze all original sample values.
Reusing Definitions
Use “Save” in “Signal Catalog” within Signal Analysis to save required definitions/Sets to MPXSIG. To reuse them for monitoring, check the scope of Load in the Signal Window Catalog, and review channel assignments and Current Set. Load replaces the Catalog and all Sets, so first save current settings under a different name.
For transmission use, see Integrating Signal Definitions with Transmission Settings. This does not automatically write analysis CSV values back to transmission settings.