Functional Overview and Basic Operations
Functional Overview
The data analysis function of MicroPeckerX LIN Analyzer Plus can analyze and visualize collected log data from multiple perspectives. Main functions are as follows.
| Function | Description |
|---|---|
| Integrated Log Analysis (Analyze tab) | Analyze logs from multiple channels together on one timeline. - Merge logs from multiple channels (Ch Mixing) - Filter display (Filtering) - Log search (Log Search) - Change timestamp display format - Load/save log files - Undo/redo operations |
| Per-Channel Log Analysis (Ch Log tab) | Analyze logs for each channel independently. - Filter display (Filtering) - Log search (Log Search) - Change timestamp display format - Load/save log files |
| Multi-Channel Log Merge (Ch Mixing) | Merge logs from multiple channels and display them together. |
| Filter Display (Filtering) | Narrow displayed logs by conditions below. - Hide error logs (Error Filtering) - Show only specific IDs (ID Filtering) - Show only specific labels (Label Filtering) |
| Log Search (Log Search) | Search logs using conditions below. - Timestamp (Time Search) - Protocol, ID, data, etc. (Log Search) - Label (Label Search) |
| Change Timestamp Display Format | Select timestamp display format from: - Elapsed time from monitoring start - Offset time based on a specific log |
| Load/Save Log Files | Load log files for display, or save currently displayed logs to a file. |
| Undo/Redo | In Analyze tab, filtering operations can be undone up to 5 steps. Redo is also available. |
These functions let you analyze large field logs efficiently and identify issues or evaluate performance smoothly.
Basic Operations
1. Start monitoring
Use one of the following.
- Select
Command-Startin the menu bar.
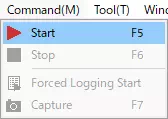
- Click
 on the toolbar.
 - Press
F5.
2. Stop monitoring
Use one of the following.
- Select
Command-Stopin the menu bar.
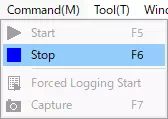
- Click
 on the toolbar.
 - Press
F6. - Press
Esc.
3. Show Analyze Window
With default settings, Analyze Window is automatically shown when monitoring stops.
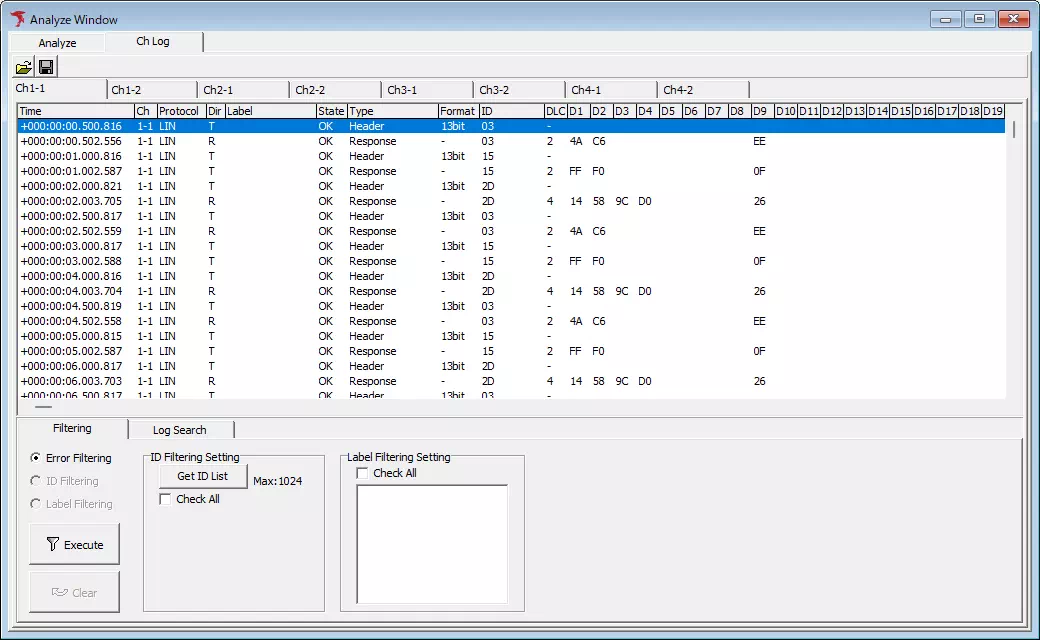
Analyze Window Description
In Analyze Window, you can analyze collected log data.
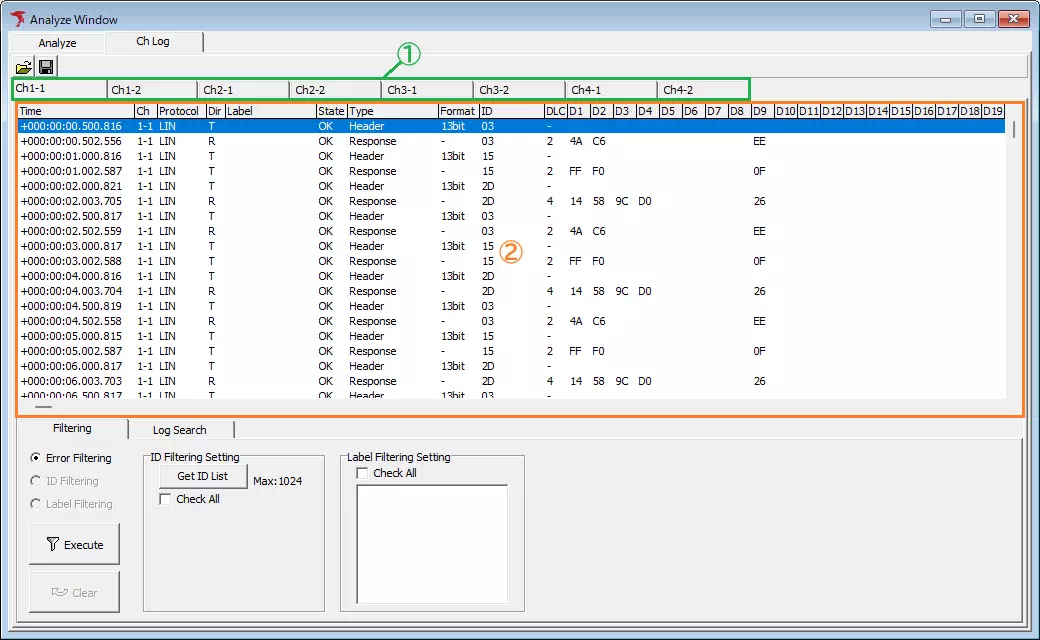
Ch Log Tab Display
In Ch Log tab, you can view and analyze logs per channel.
| Item | Description | Notes |
|---|---|---|
 button button | Opens Analyze Load Log dialog and loads log files in batch per channel.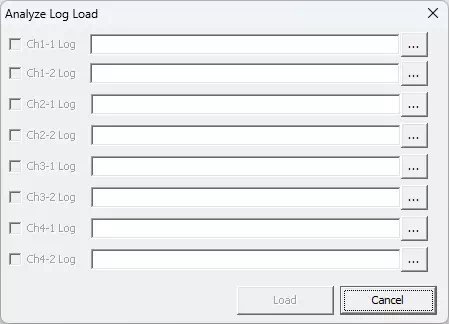 | MicroPecker Analyzer log files are also supported. In that case, load result (valid/invalid log counts) is shown.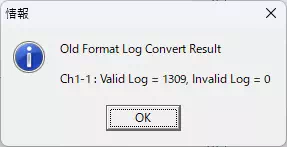 |
 button button | Opens file dialog and saves logs currently shown in log display area to a file. | If no logs are shown, this button is disabled. |
| Channel tab (Area 1) | Select target channel for log display and analysis by tab. | |
| Log display area (Area 2) | Shows logs captured during monitoring or loaded from log files. | |
| Filtering tab | Narrows log data shown in log display area by specific conditions. | See Filter Display Function. |
| Log Search tab | Searches for log data matching specific conditions from log display area. | See Log Search Function. |
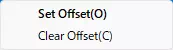
Right-clicking the log display area shows the menu below, where timestamp offset display can be enabled/disabled.
| Item | Description | Notes |
|---|---|---|
| Set Offset | Enables timestamp offset display. Timestamps are shown as offset values based on the selected log in log display area. | Double-clicking a selected log applies the same offset behavior. |
| Clear Offset | Disables timestamp offset display. Timestamps return to elapsed time from monitoring start. |
Analyze Tab Display

| Item | Description | Notes |
|---|---|---|
| button | Opens file dialog and loads selected log file. | MicroPecker Analyzer log files are not supported here. If loaded, error dialog below is shown.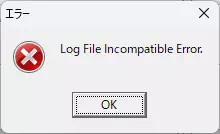 |
| button | Opens file dialog and saves logs currently shown in log display area to a file. | If no logs are shown, this button is disabled. |
| Log display area (Area 1) | Shows logs captured during monitoring or loaded from log files. | |
 button button | Undoes the latest filtering operation. | Undo is available up to 5 steps. |
 button button | Redoes an undone filtering operation. | |
| Ch Mixing tab | From channels shown in Ch Log tab, selected channels can be merged and displayed in the log display area. | See Multi-Channel Log Merge Function. |
| Filtering tab | Narrows log data shown in log display area by specific conditions. | This tab is shown only after logs are merged in Ch Mixing tab. See Filter Display Function. |
| Log Search tab | Searches for log data matching specific conditions from log display area. | This tab is shown only after logs are merged in Ch Mixing tab. See Log Search Function. |
| CAN GW Analyze tab | Performs CAN gateway analysis. LIN bus, DIO, and AD log data are excluded. | This tab is shown only after logs are merged in Ch Mixing tab. See CAN GW Analysis Function. |