Monitor Window
Monitor Window displays log data captured during monitoring in real time. Main functions are as follows.
| Function | Description |
|---|---|
| Per-channel tab display | You can select the channel to display from log data of up to 8 channels. |
| Log display view mode | Two view types are available. - Single View: displays one channel in a large area. - Dual View: displays two channels side by side. |
| LIN bus traffic graph | Displays communication load (bus utilization) for each channel in real time. |
This allows you to monitor multiple buses while checking load status at a glance.
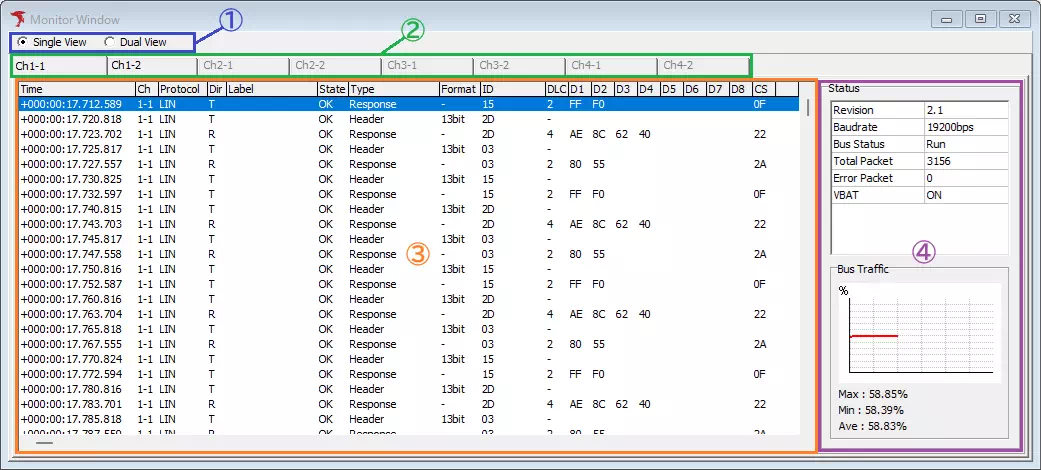
Monitor Window Description
| Item | Description | Notes |
|---|---|---|
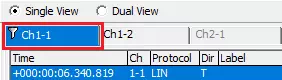
| Log display view mode setting (Area 1) | Switches log display view mode. Radio options are: Single View, Dual View | See Log Display View Mode. |
| Channel selection tab (Area 2) | When view mode is Single View, you can select the target channel by tab. | When view mode is Dual View, channel-selection pull-down menus are shown instead of tabs. |
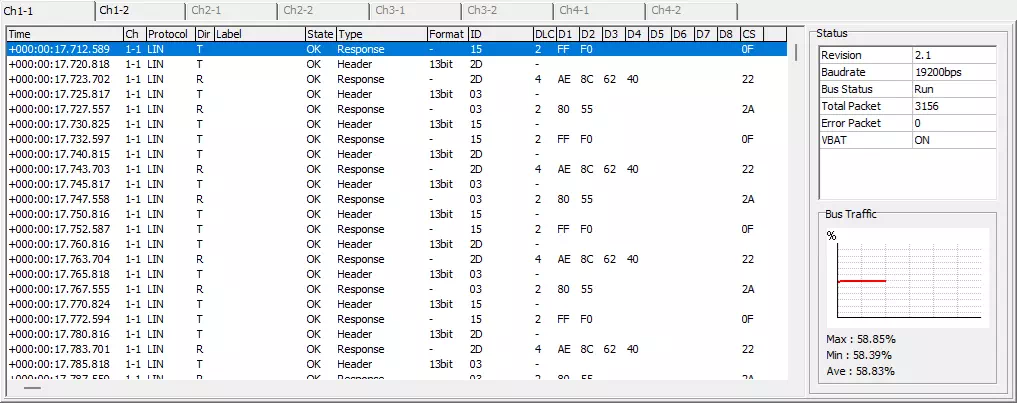
| Log display area (Area 3) | Displays LIN bus monitoring log data. | See Log Display Area for displayed fields. |
| Status (Area 4) | Displays LIN bus load status and related information. | This area is shown only when Single View is selected. See Status Display. |
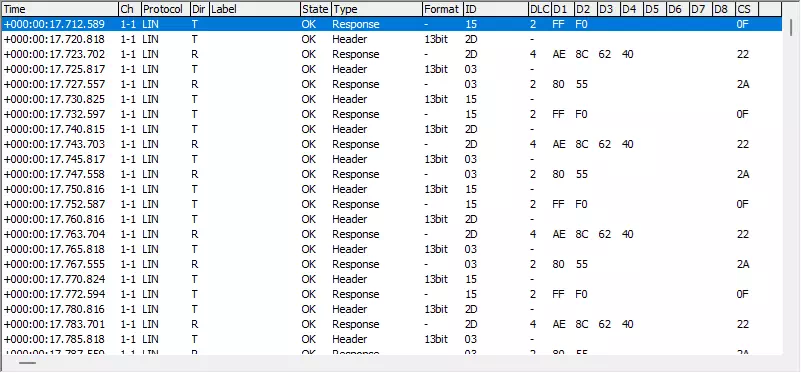
Log Display Area
| Item | Description | Notes |
|---|---|---|
| Time | Displays Tx/Rx timestamp. | Format follows Time Stamp Form in Option dialog. |
| Ch | Displays Tx/Rx channel. | |
| Protocol | Displays Tx/Rx protocol. | |
| Dir | Displays T for transmitted frames and R for received frames. | If Type is B-Sleep (no frame Tx/Rx), - is shown. |
| Label | Displays label name when frame matches label filter condition set in Label Filter Window. | See Label Function. |
| State | Displays OK for normal frames and NG for error frames. | |
| Type | Displays frame type. | |
| Format | Displays break-field bit width or wakeup signal Tx/Rx time. Target Type values are:Break-field bit width: Header, LIN Frm., Sleep, SyncBrk. Short, Parity Err., SyncField Err. Wakeup signal Tx/Rx time: Wakeup | For Type values not listed, - is shown. |
| ID | Displays Tx/Rx ID in hexadecimal. | |
| DLC | Displays Tx/Rx data length. | |
| D1-D8 | Displays Tx/Rx data in hexadecimal. | If framing error occurs, - is shown. |
| CS | Displays Tx/Rx checksum. | If framing error occurs, - is shown. |
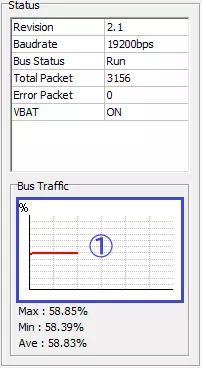
Status Display
Displays bus status and traffic status per channel.
Shown only when Single View is selected.
| Item | Description | Notes | |
|---|---|---|---|
| Revision | Displays LIN revision configured in Device Window. | ||
| Baudrate | Displays communication baudrate configured in Device Window. | ||
| Status | Displays LIN bus status as one of: Wakeup, Sleep, Run | ||
| Total Packet | Displays number of data frames transmitted/received during monitoring. This count includes error frame count shown in Error Packet. | If LIN/CXPI : Calculate Wakeup pulses as packets is enabled in Option dialog, wakeup signals are also counted as data frames. | |
| Error Packet | Displays number of error frames during monitoring. | ||
| VBAT | Displays whether VBAT power is supplied.ON: VBAT power supplied.OFF: VBAT power not supplied. | ||
| Bus Traffic | Graph (Area 1) | Displays change in bus load over latest 1 minute during monitoring. Graph update interval is 1 second. Right-click this area to show Copy menu. Selecting it copies graph image to clipboard in Windows Metafile (WMF) format. | Graph axes: X-axis = elapsed time (1 division = 10 sec) Y-axis = bus load (1 division = 10%) |
| Max | Displays maximum bus load during monitoring. | ||
| Min | Displays minimum bus load during monitoring. | ||
| Ave | Displays average bus load during monitoring. | ||
Log Display View Mode
Two view modes are available: Single View and Dual View, switched by radio buttons.
For channels with Filter Enabled checked in Display Filter Window, a filter icon is shown in channel selector.
Single View
Displays monitoring log data for one channel in log display area, and bus/traffic status in Status. Target channel is selected by tab.
If Filter Enabled is active in Display Filter Window, filter icon appears on channel tab as shown below.
Dual View
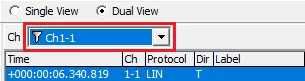
Displays monitoring log data of two channels side by side in log display area. Target channels are selected by pull-down menus.
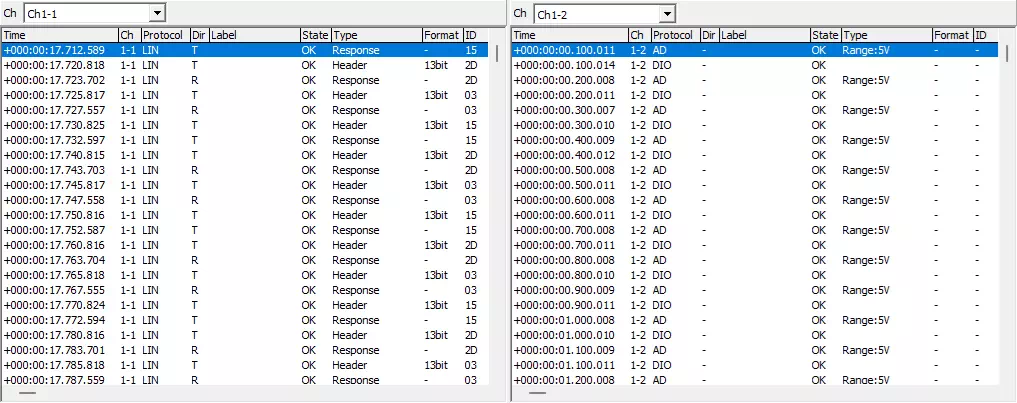
If Filter Enabled is active in Display Filter Window, filter icon appears in channel selection pull-down menus as shown below.