Product Usage Flow
This section explains the complete flow from connecting MicroPeckerX LIN Analyzer Plus to operation.
1. Connect devices
Connect the MicroPeckerX unit to the LIN bus and a Windows PC as follows.
- Connect the MicroPeckerX unit to the LIN bus.
When using the separately sold LIN cable (S810-MX-CB3), connect the D-sub connector side to the MicroPeckerX unit and the clip side to each LIN bus terminal. - Use the USB cable included with this product to connect the MicroPeckerX unit to a USB port on the Windows PC.

- Incorrect connections may damage both the MicroPeckerX unit and the LIN bus side.
- If the MicroPeckerX unit is connected via a bus-powered USB hub, USB power from the Windows PC alone may be insufficient, causing unstable operation. Use a self-powered USB hub (with external power supply).
2. Launch GUI application
Launch the GUI application as follows.
- Open the Windows Start menu.
- Show "All" apps in the app list.
- Expand the "MicroPeckerX" folder from the app list.
- Select "MicroPeckerX Control Software Ver.X.XX" (X.XX is the product version).
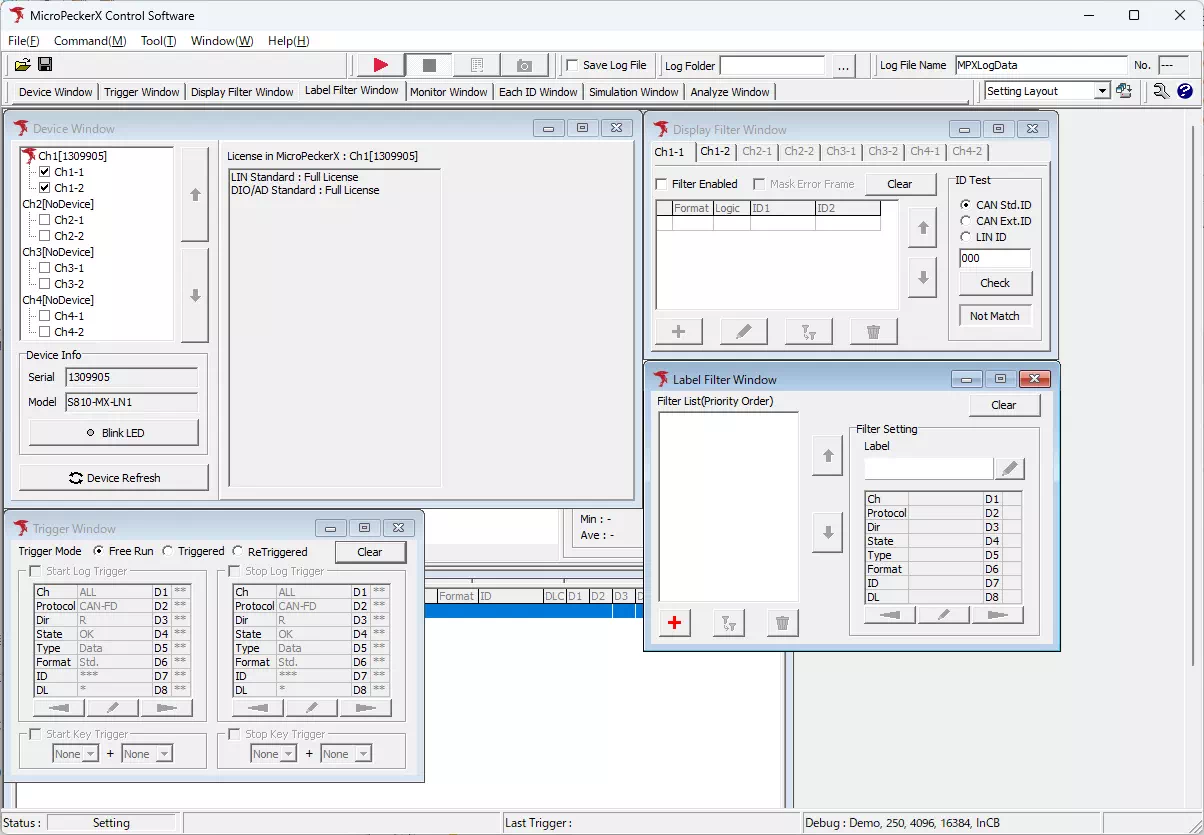
Toolbar
You can freely configure the toolbar at the top of the screen and the layout of each window. Adjust them for ease of use based on your monitor size.

Save/switch window layout
Window layout in the GUI application can be saved with any name and recalled at any time.
- You can also rename layouts later or delete saved layouts.
- Register frequently used layouts in advance to improve work efficiency.
- Open the layout save dialog
Display the Save Current Layout dialog by either of the following operations.
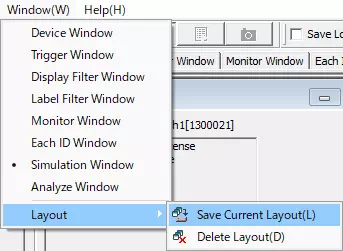
- Select "Window" - "Layout" - "Save Current Layout" on the menu bar.
- Click the
 button on the toolbar.
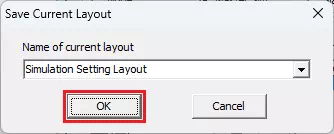
- Save layout
Enter any layout name in "Name of current layout" in the Save Current Layout dialog and click the button.
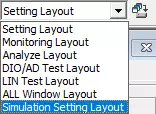
- Recall a saved layout
Select the layout you want to display from the Layout pull-down menu on the toolbar.
3. Configure communication
Configure communication settings for MicroPeckerX LIN Analyzer Plus.
-
Open Device Window
Select "Device Window" from the menu or toolbar. -
Select Ch for LIN bus
From the device list shown on the left side of "Device Window", select "Chx-1" (x is 1 to 4).
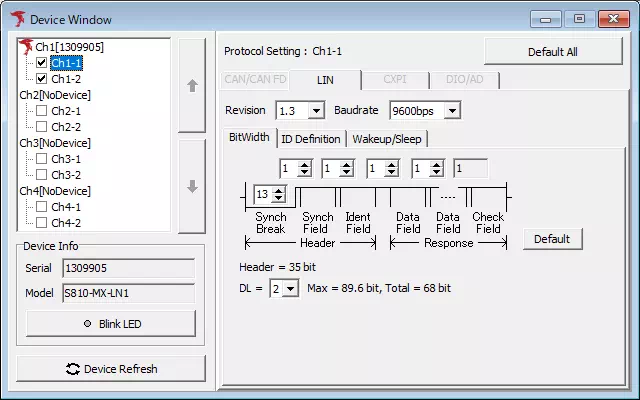
-
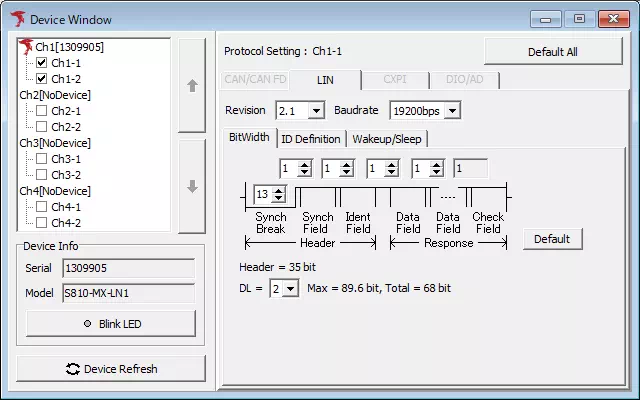
Select revision and baud rate
In the "LIN" tab of "Device Window", select revision and baud rate from the pull-down menu. -
Set bit width
If you want to change bit widths such as SyncBreak, select the "BitWidth" tab in the "LIN" tab of "Device Window" and modify settings as needed.
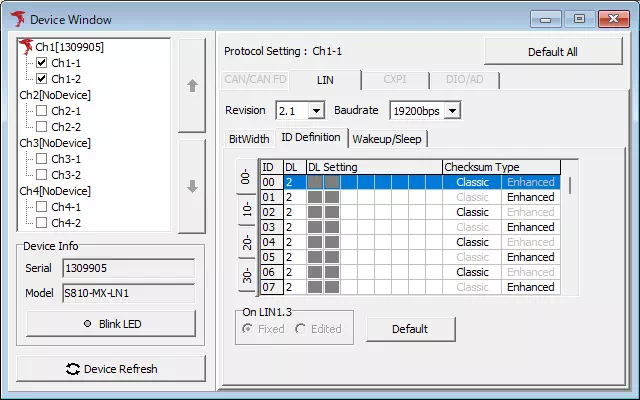
- Set ID definition
If you want to change data length or checksum format for each ID, select the "ID Definition" tab in the "LIN" tab of "Device Window" and modify settings as needed.
- Set wake-up pulse width and bus sleep time
If you want to change wake-up pulse width or bus sleep time, select the "Wakeup/Sleep" tab in the "LIN" tab of "Device Window" and modify settings as needed.

4. Configure screen display
Using the label function helps make logs that match specific conditions easier to read.
If not needed, proceed to "5. Select operation mode".
Label filter setup procedure
- Open Label Filter Window
Select "Label Filter Window" from the menu or toolbar.
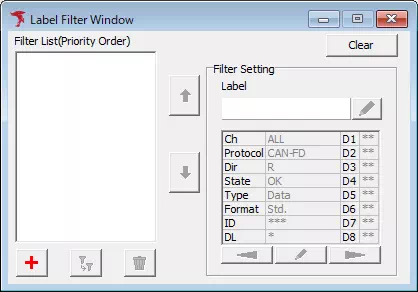
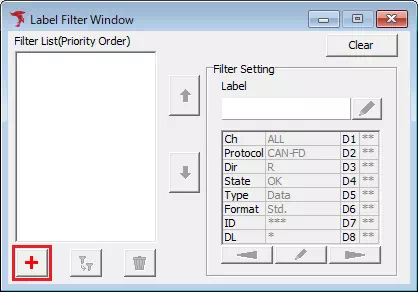
- Open Label Filter Setting dialog
Click the button. The Label Filter Setting dialog appears.
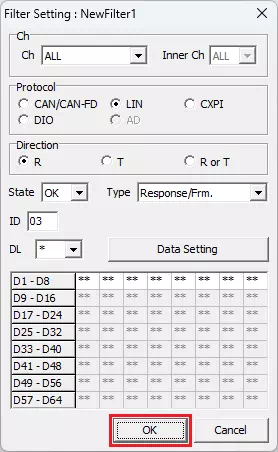
- Set label filter conditions
In the Label Filter Setting dialog, set conditions (protocol, channel, TX/RX direction, etc.) for logs to which labels are applied, then click the button.
- Open Label Setting dialog
Select the label registered in step 3 from the Filter List and click the button. The Label Setting dialog appears.
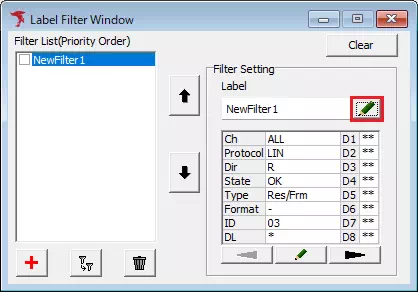
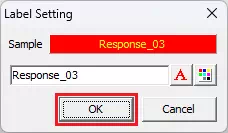
- Set label style
In the Label Setting dialog, set label style (label name, text color, background color), then click the button.
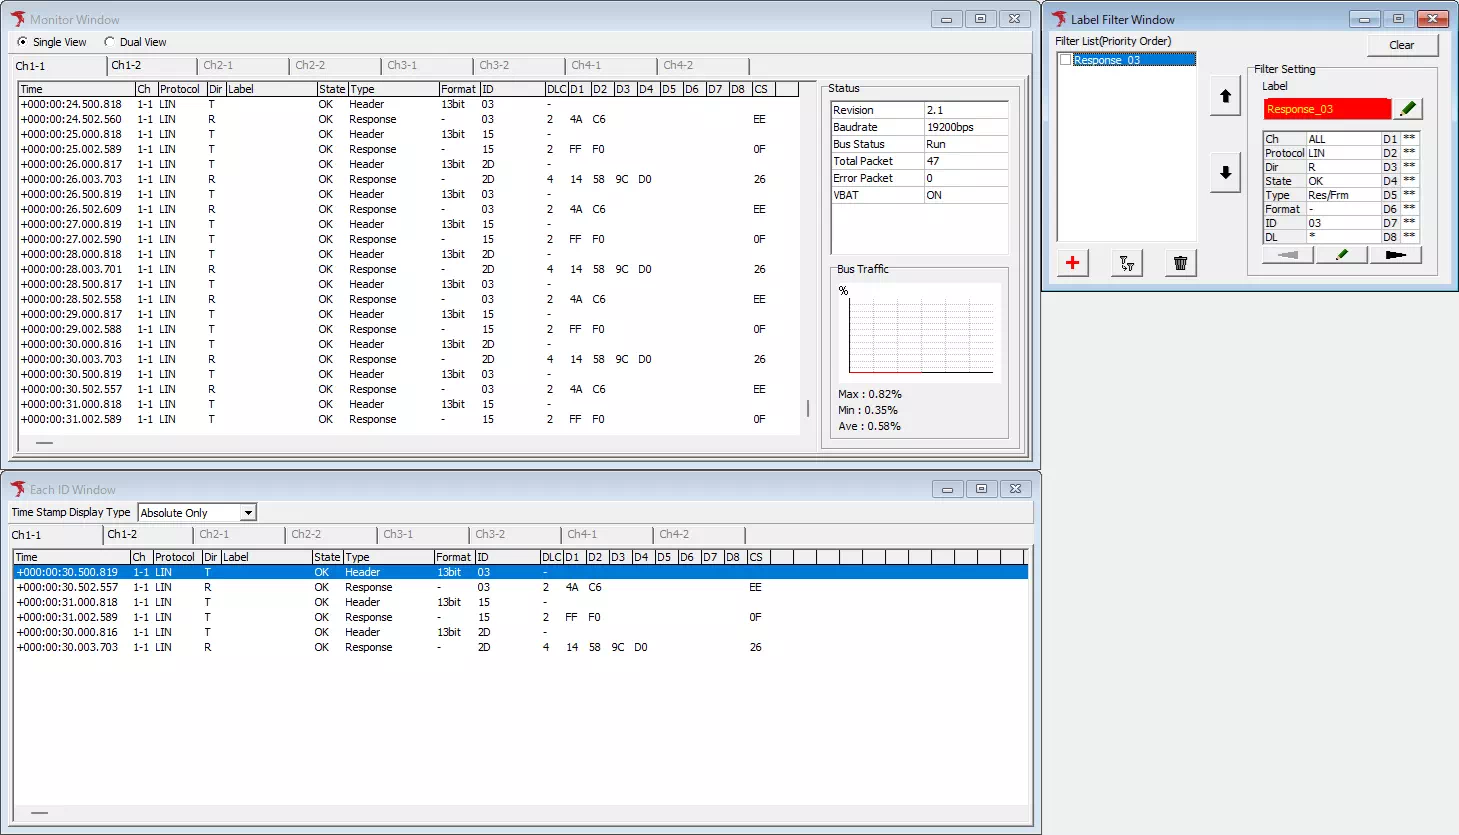
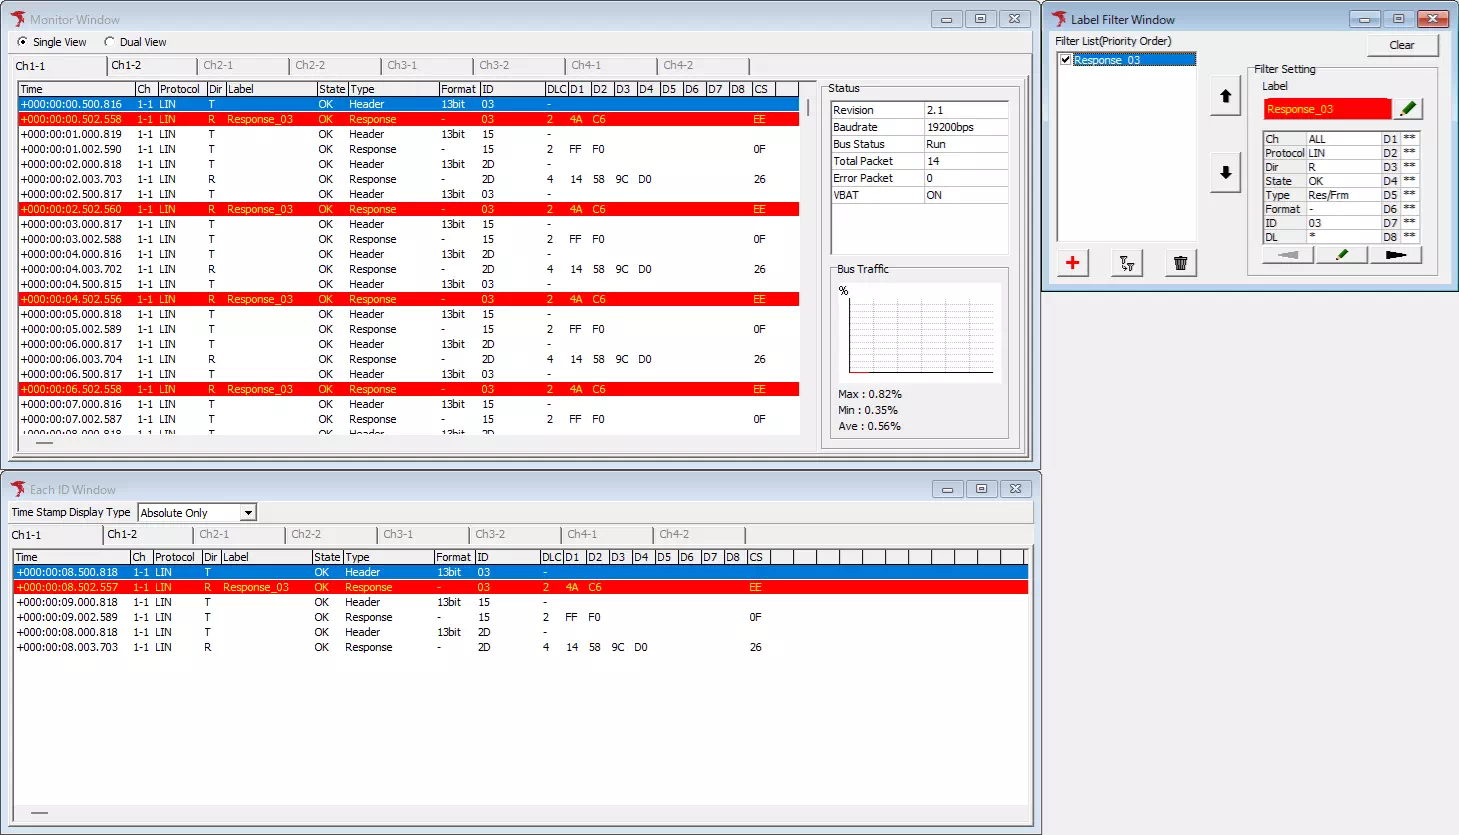
Example log display with label function disabled/enabled
The following shows the difference in log display when the label function is disabled/enabled with this label registered.
| LIN ID | Label Name | Text Color | Background Color | Filter Condition |
|---|---|---|---|---|
| 03H | Response_03 | Yellow | Red | Response only |
Label function disabled
Label function enabled
5. Select operation mode
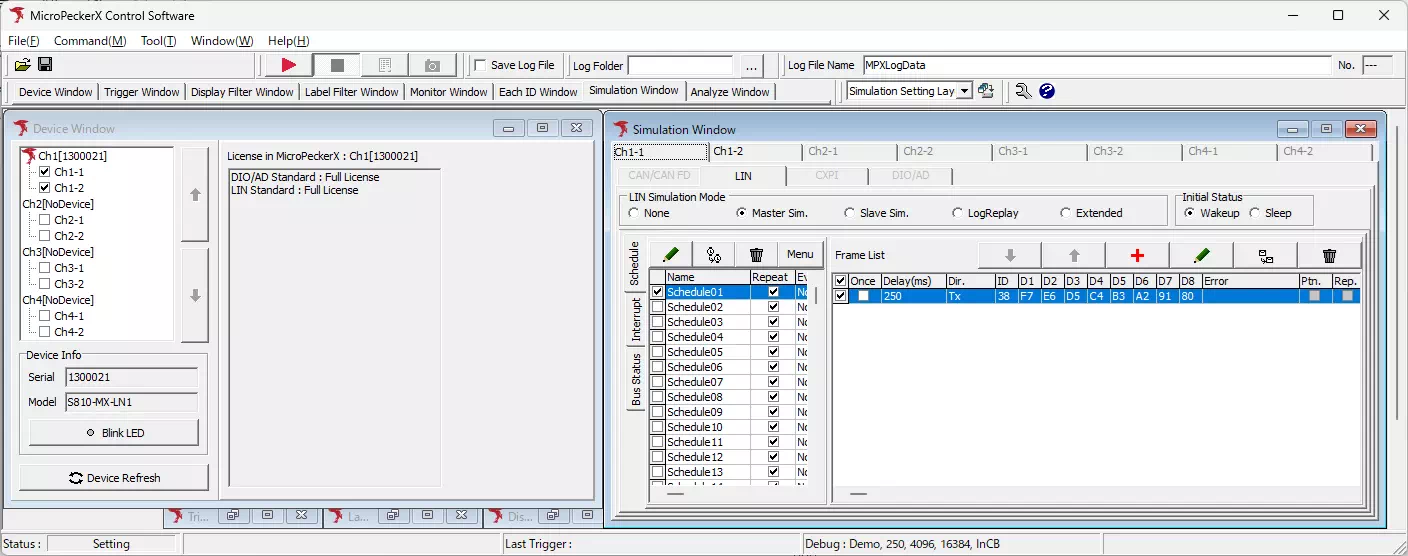
Select the operation mode of MicroPeckerX LIN Analyzer Plus in the Simulation Window.
- Open Simulation Window
Select "Simulation Window" from the menu or toolbar.
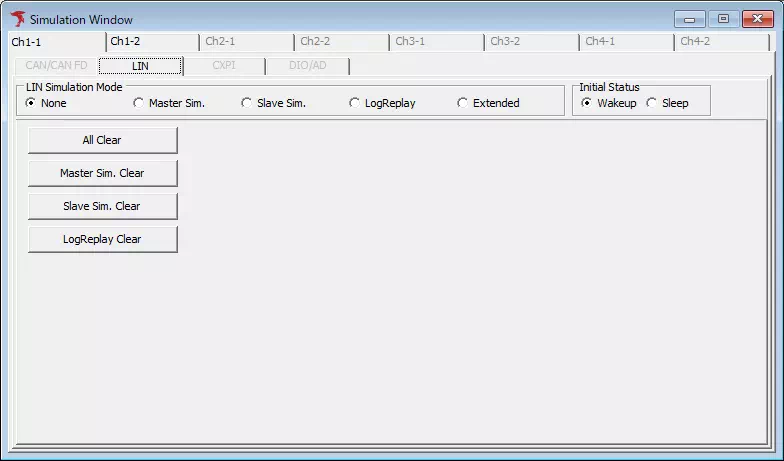
- Select LIN Simulation Mode
Select "LIN Simulation Mode" from the following options.
| Simulation Mode | Description |
|---|---|
| None | Mode that only monitors and displays communication on the LIN bus. No frame transmission is performed. |
| Master Sim. | Operates as a master node. You can set schedules to transmit header-only frames or header + response frame sets. You can also interrupt and transmit frames at arbitrary timing. |
| Slave Sim. | Operates as a slave node. You can set response frames returned when receiving header-only frames from the master node. |
| Log Replay | Transmits frames based on preprepared transmission logs. |
| Extended | This mode is not available in the current version. |
Even when selecting a mode other than None, communication on the LIN bus can still be monitored and displayed.
6. Start monitoring
Start monitoring by either of the following operations.
- Select "Command" - "Start" from the menu bar.
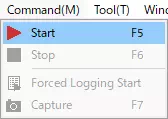
- Click the
 button on the toolbar.
 - Press the F5 key.
Depending on "Option Settings", screen layout may automatically switch to Monitor Layout when monitoring starts.
7. Stop monitoring
Stop monitoring by either of the following operations.
- Select "Command" - "Stop" from the menu bar.
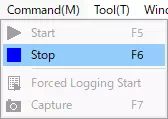
- Click the
 button on the toolbar.
 - Press the F6 key.
- Press the Esc key.
Depending on "Option Settings", screen layout may automatically switch to Analyze Layout when monitoring stops.
8. Check and analyze logs
After monitoring stops, recorded logs can be displayed and processed in the Analyze Window.
This section introduces how to use the "Search Function" and "Offset Function".
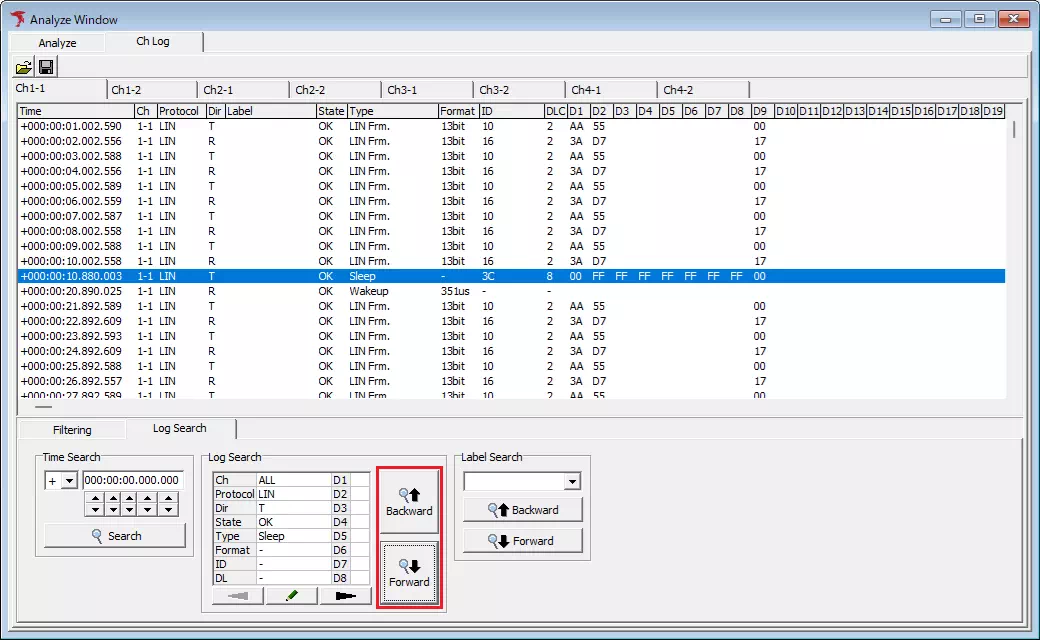
Search function
The search function allows you to find logs that match specific conditions.
The following explains how to search transmission logs for sleep commands.
- Open the "Log Search" tab and click the
 button in the "Log Search" area. This opens the "Search Setting" dialog.
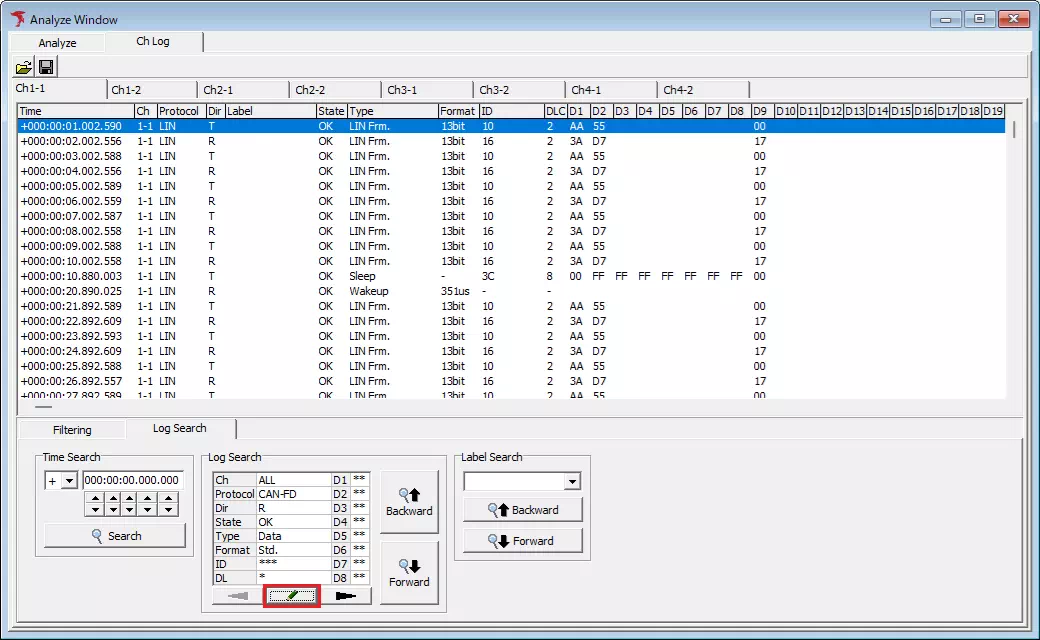
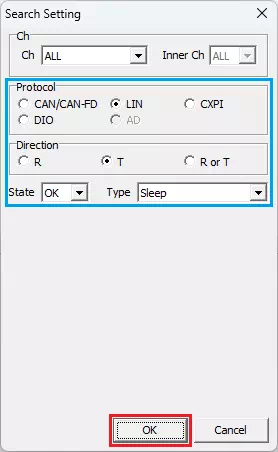
- In the "Search Setting" dialog, select "LIN" for Protocol, "T" for Dir, and "Sleep" in the Type pull-down menu, then click the button.
- Click the
 button or
  button in the "Log Search" area. The cursor in the log display area moves to frames that match the condition set in step 2.
Offset function
Using the offset function, you can set a specific log as a reference point and display timestamps of other logs as offset time from that point.
The following explains the procedure when using a wake-up log as the reference point.
- In the log display area, right-click the log you want to use as the reference point. The context menu appears.
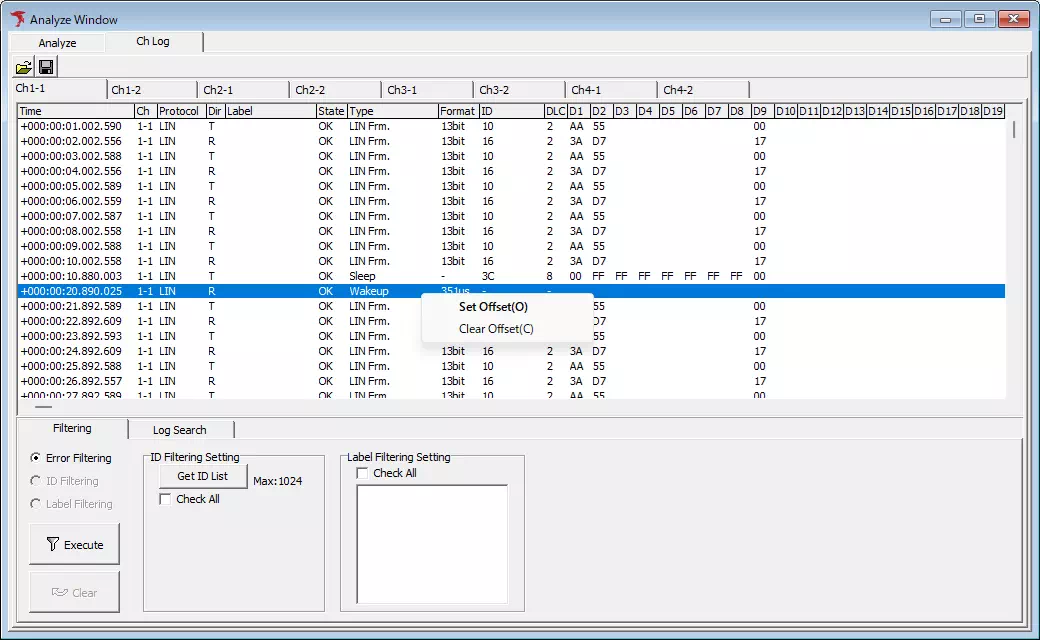
- Select "Set Offset" from the context menu. This enables the offset function. The selected log timestamp becomes zero, and timestamps of other logs are displayed as offset time from the reference point.
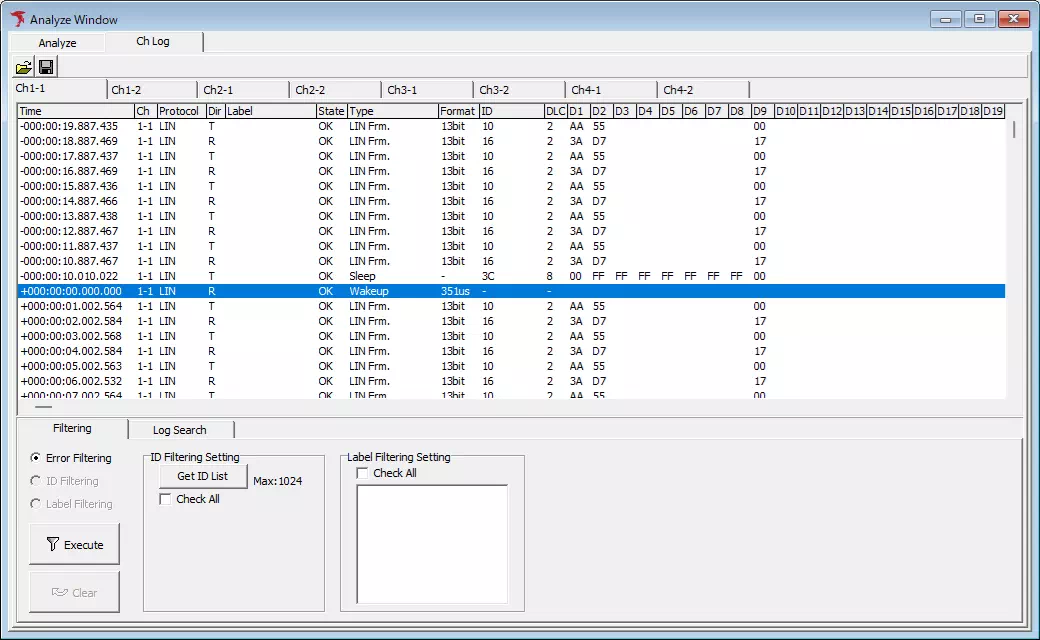
To disable the offset function, select "Clear Offset" from the context menu.
You can also enable the offset function by double-clicking the log you want to use as the reference point.