Option Settings
In the Option dialog, you can adjust detailed behavior related to monitoring, log display, logging, and more.
Option Setting Procedure
- Open Option dialog
SelectTool-Optionin the menu bar, or click on the toolbar.
- Change option settings
Change desired settings in Option dialog. ClickOKto apply changes.
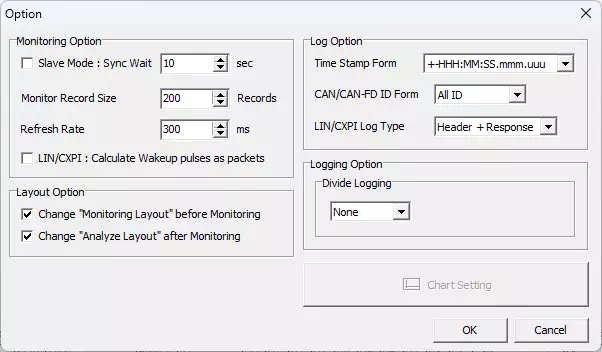
Option Dialog Description
| Item | Description | Notes | |
|---|---|---|---|
| Monitoring Option | Slave Mode | Enables/disables slave mode. When enabled, the system works as a time-synchronization slave. By entering sync-wait state, monitoring can start/stop automatically in sync with time-sync master start/stop (timing error of several tens of milliseconds may occur at stop). | Use this when running MicroPeckerX and MicroPecker in time sync, or when running multiple MicroPeckerX units across two PCs in time sync, and this unit should operate as the time-sync slave. |
| Sync Wait | When slave mode is enabled, specifies maximum wait time (seconds) for synchronization signal from time-sync master after slave enters sync-wait state. Range: 1-60. | If no sync signal is received within configured Sync Wait time, Monitor synchronization error. occurs and sync-wait state is released. | |
| Monitor Record Size | Sets upper limit of log records kept/displayed in Monitor Window. Range: 100-1000. | When changed by spin button, value changes in increments of 100. | |
| Refresh Rate | Sets redraw interval (display update timing) of GUI windows in milliseconds. Range: 100-1000. | When changed by spin button, value changes in increments of 100 ms. | |
| LIN/CXPI : Calculate Wakeup pulses as packets | For LIN/CXPI communication, sets whether wakeup signals are included in packet count shown in Monitor Window Status.ON: include wakeup signals.OFF: do not include wakeup signals. | For Status display after monitoring has stopped, changing this setting is not reflected. | |
| Layout Option | Change "Monitoring Layout" before Monitoring | Sets whether screen layout changes automatically when monitoring starts.ON: layout changes to Monitoring Layout at start.OFF: layout does not change at start. | |
| Change "Analyze Layout" before Monitoring | Sets whether screen layout changes automatically when monitoring stops.ON: layout changes to Analyze Layout at stop.OFF: layout does not change at stop. | ||
| Log Option | Time Stamp Form | Sets display format of log-record timestamp. Pull-down options:+-HHH:MM:SS.mmm.uuu, +-SSSSSSS.mmmuuu | This setting is also applied when saving log files. If a log file saved with different settings is loaded, timestamp display is automatically converted to current setting. |
| CAN/CAN-FD ID Form | Sets ID display format for CAN extended format. Options:ALL ID: displays standard ID (SID) and extended ID (EID) as one continuous 29-bit value (upper 11 bits = SID, lower 18 bits = EID).SID/EID: displays SID and EID separately (left = SID, right = EID). | This setting is also applied when saving log files. If a log file saved with different settings is loaded, ID display format is automatically converted to current setting. | |
| LIN/CXPI Log Type | Sets LIN/CXPI log display format in Monitor Window, Each ID Window, and Analyze Window. Options:Header + Response: header and response are shown separately (Type = Header / Response).LIN/CXPI Frame: header and response are integrated (Type = LIN Frame or CXPI Frame). | This setting is also applied when saving log files. However, when loading logs saved with different settings, display format is not converted. Also, changing this setting does not affect format of logs already displayed in windows. | |
| Logging Option | Divide Logging | Sets whether log files are automatically split by specific conditions. Options:None: no auto-split.FileSize: split when file size reaches threshold. Range: 1-4095 MB.Record: split when number of saved records reaches threshold. Range: 100-2500000.Time: split when elapsed time from logging start reaches threshold. Range: 1-3600 seconds. | This setting applies only to automatically saved log files during monitoring. |
| Chart Setting | Configures chart display settings. | This feature is under development and currently unavailable. | |