Product Usage Flow
This section explains the overall flow from connecting MicroPeckerX LIN Analyzer Plus to operation.
1. Connect Devices
Connect the MicroPeckerX unit to DIO/AD monitoring points and the Windows PC as follows.
- Connect the MicroPeckerX unit and DIO/AD monitoring points.
- Use the included USB cable to connect the MicroPeckerX unit to a USB port on the Windows PC.
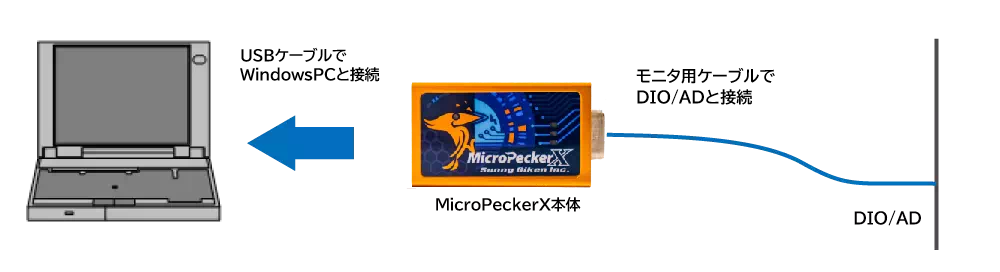
- Incorrect wiring may damage both the MicroPeckerX unit and the DIO/AD side.
- If the MicroPeckerX unit is connected through a bus-powered USB hub, USB power from the Windows PC may be insufficient and operation may become unstable. Use a self-powered USB hub (with external power).
2. Start GUI Application
Start the GUI application as follows.
- Open the Windows Start menu.
- Show
Allin the app list. - Expand the
MicroPeckerXfolder from all apps. - Select
MicroPeckerX Control Software Ver.X.XX(X.XX is product version).
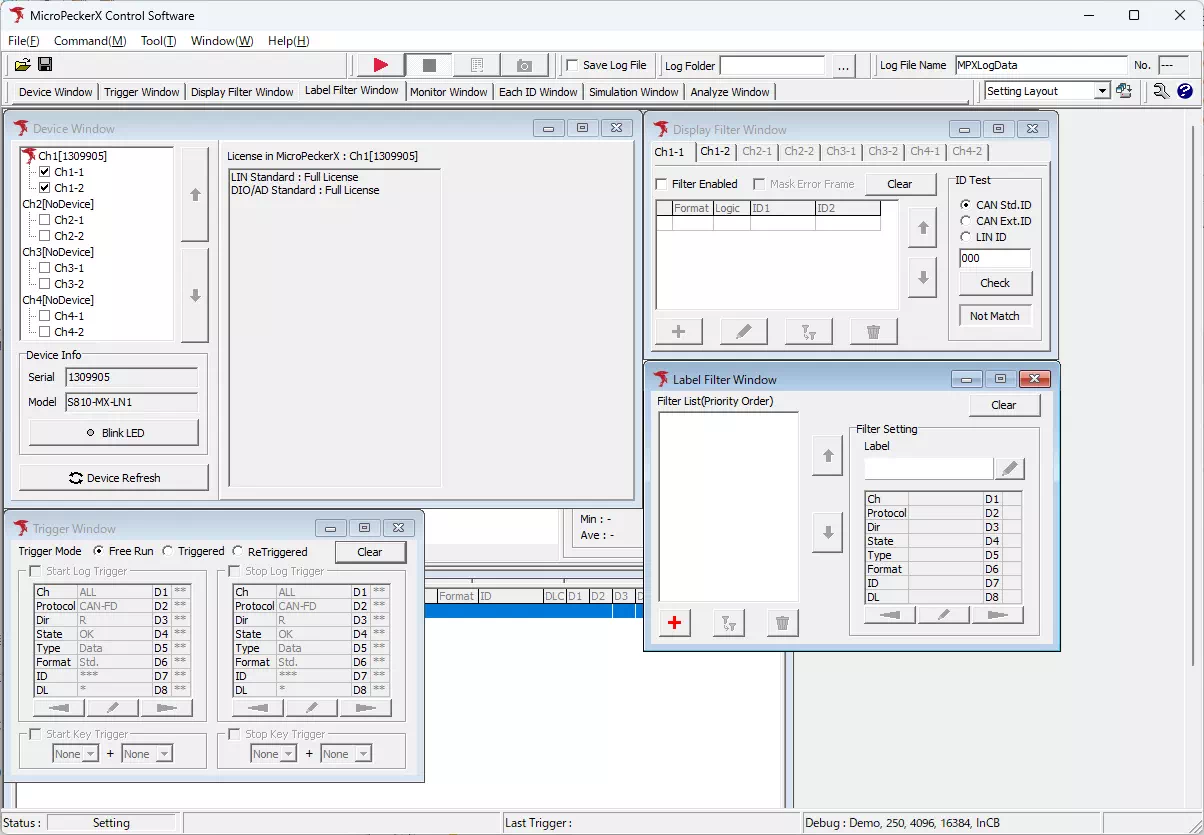
Toolbar
The top toolbar and each window layout can be configured freely. Adjust to suit your monitor size.

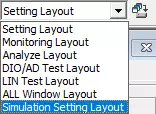
Save/Switch Window Layout
Window arrangements in the GUI can be saved with any name and recalled anytime.
- You can rename layouts later and delete saved layouts.
- Registering frequently used layouts improves work efficiency.
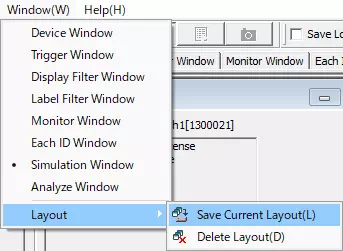
- Open Save Current Layout dialog
Perform either operation below to openSave Current Layout.
- Select
Window-Layout-Save Current Layoutfrom the menu bar.
- Click
 on the toolbar.
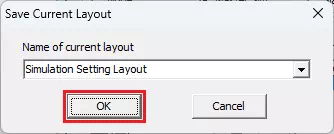
- Save layout
Enter any layout name inName of current layout, then click .
.
- Recall saved layout
Select the layout from theLayoutpull-down menu on the toolbar.
3. Monitor Settings
Configure DIO/AD monitoring settings.
-
Open Device Window
SelectDevice Windowfrom the menu or toolbar. -
Select DIO/AD channel
SelectChx-2(xis 1 to 4) from the device list on the left side ofDevice Window.
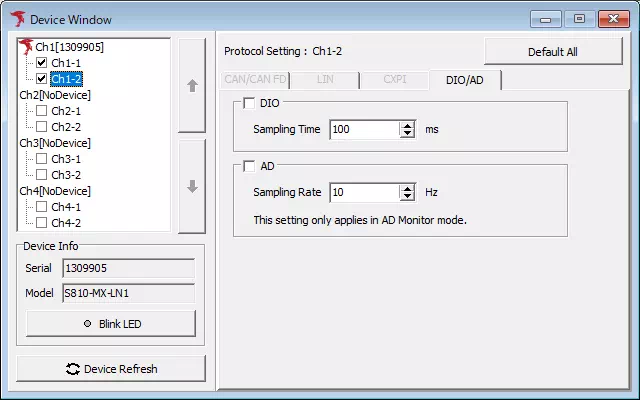
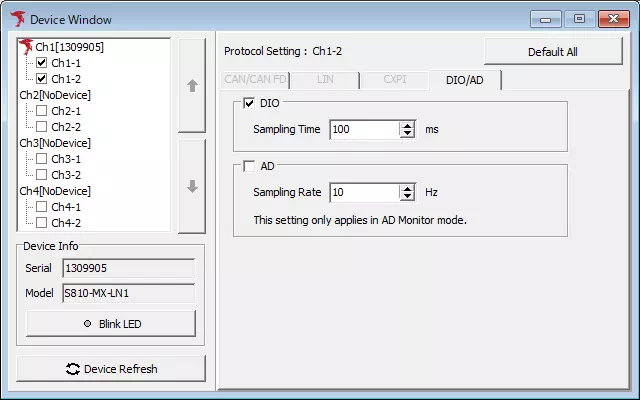
- Configure DIO
To monitor DIO, checkDIOin theDIO/ADtab ofDevice Window, then set sampling cycle.
- Configure A/D
To monitor A/D, checkADin theDIO/ADtab ofDevice Window, then set sampling frequency.
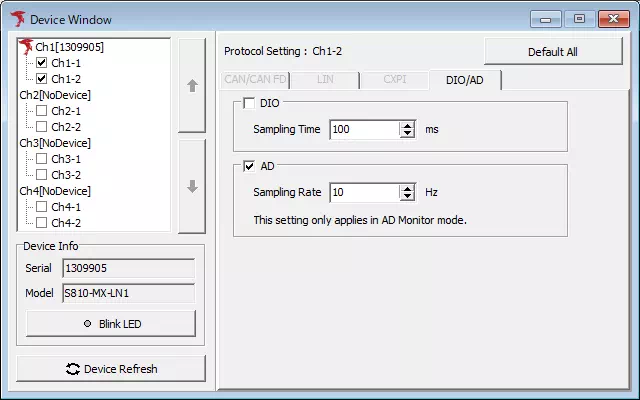
You can monitor DIO and A/D simultaneously.
4. Screen Display Settings
Using the label function makes logs that match specific conditions easier to read.
If unnecessary, proceed to 5. Operation Mode Settings.
The label function is available only for DIO logs. It is not available for A/D logs.
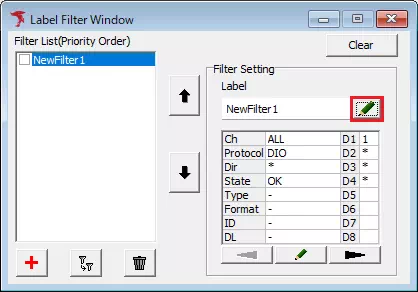
Label Filter Setup
- Show Label Filter Window
SelectLabel Filter Windowfrom the menu or toolbar.
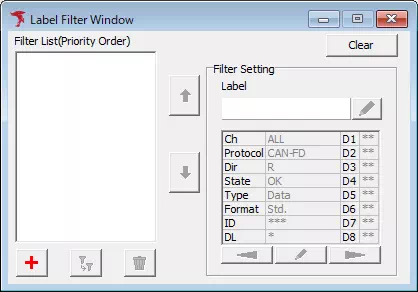
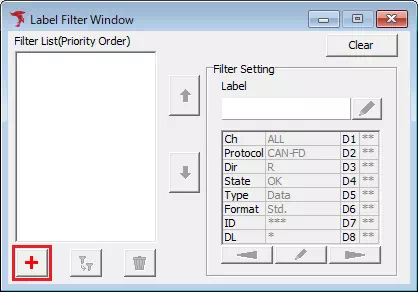
- Show Label Filter Setting dialog
Click .
. Label Filter Settingappears.
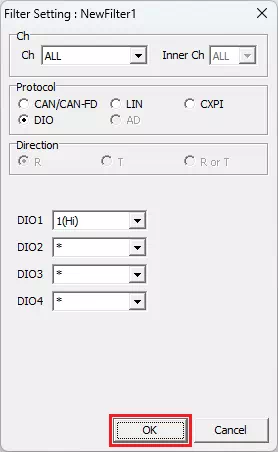
- Set label filter conditions
InLabel Filter Setting, set conditions (protocol, channel, etc.) and click .
.
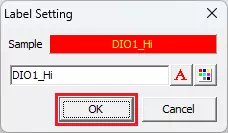
- Open Label Setting dialog
Select the label registered in step 3 fromFilter List, then click .
. Label Settingappears.
- Set label style
InLabel Setting, configure label name, font color, and background color, then click .
.
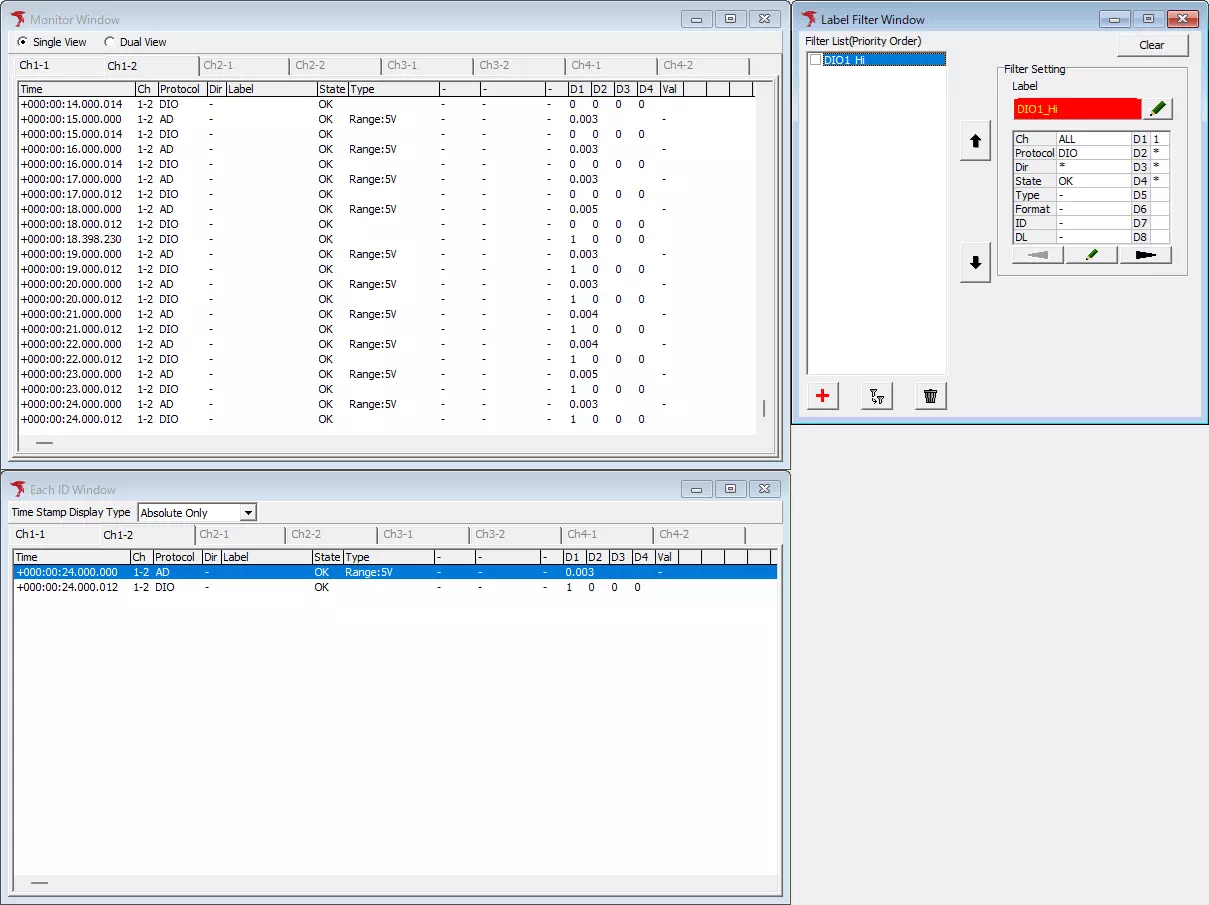
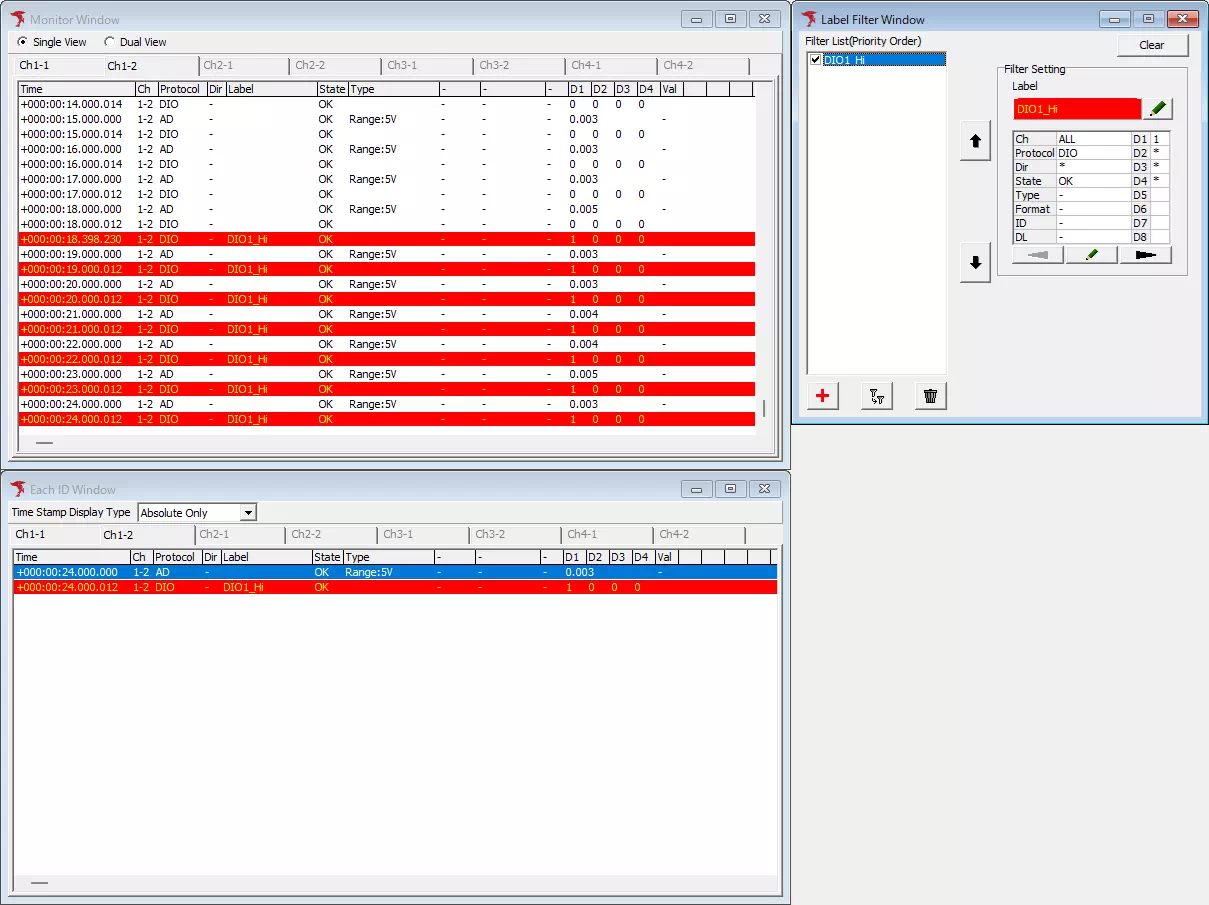
Log Display Example (Label ON/OFF)
The following shows display differences when the label below is registered.
| Label Name | Font Color | Background Color | Filter Condition |
|---|---|---|---|
| DIO1_Hi | Yellow | Red | DIO1 is Hi |
Label Disabled
Label Enabled
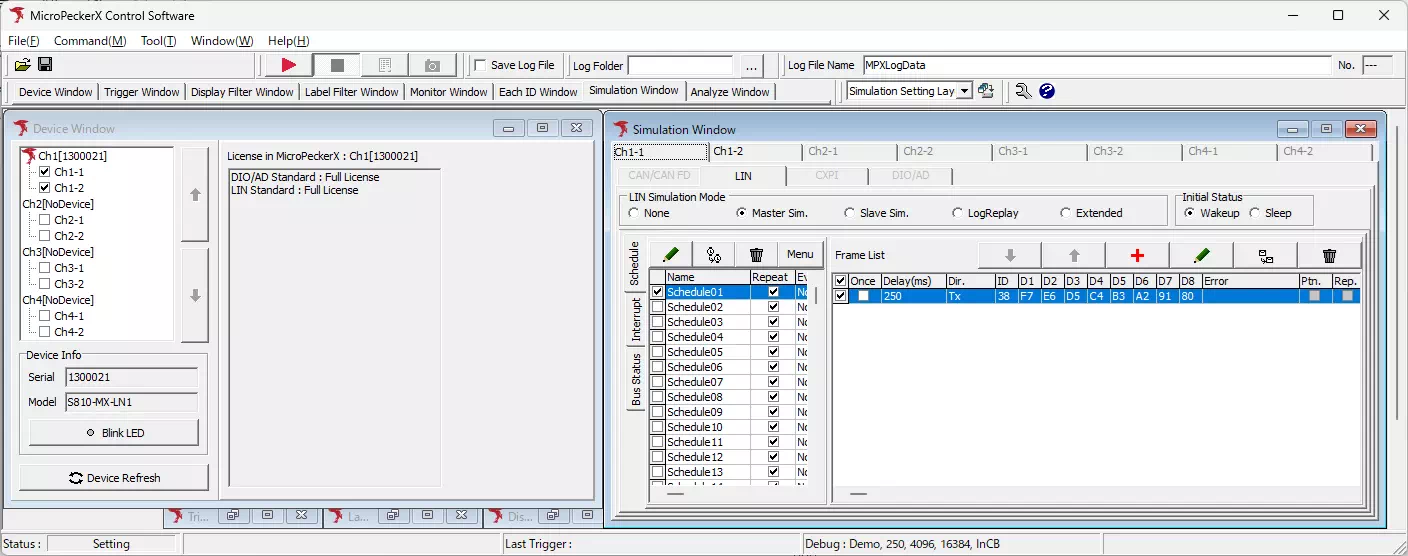
5. Operation Mode Settings
Configure DIO/AD monitor operation in Simulation Window.
-
Open Simulation Window
SelectSimulation Windowfrom the menu or toolbar. -
Configure DIO
If monitoring DIO, use theDIOtab to configure electrical signal input/output direction.
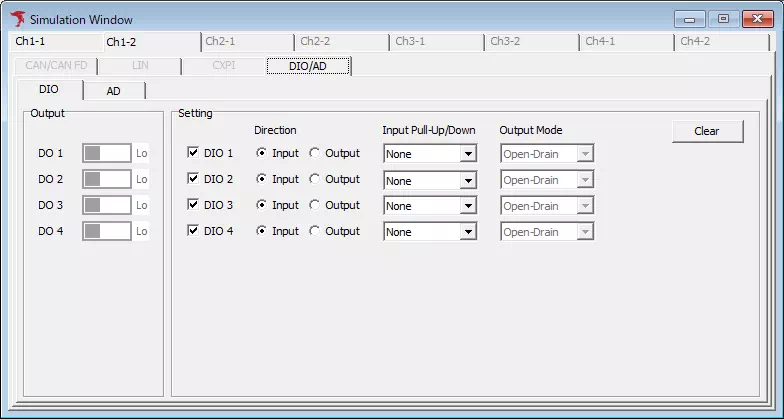
If DIO checkbox in Device Window > DIO/AD tab is OFF, DIO is not available is shown.
- Configure A/D
If monitoring A/D, use theADtab and select monitorable data range from the pull-down menu.
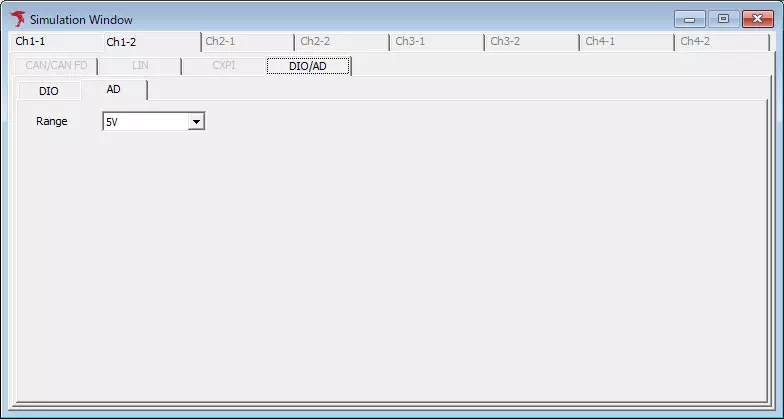
If AD checkbox in Device Window > DIO/AD tab is OFF, AD is not available is shown.
6. Start Monitoring
Start monitoring using any of the following:
- Select
Command-Startfrom the menu bar.
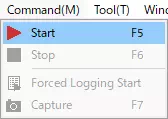
- Click
 on the toolbar.
 - Press
F5.
Depending on Option Settings, layout may automatically switch to Monitor Layout when monitoring starts.
7. Stop Monitoring
Stop monitoring using any of the following:
- Select
Command-Stopfrom the menu bar.
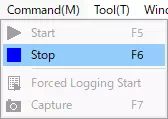
- Click
 on the toolbar.
 - Press
F6. - Press
Esc.
Depending on Option Settings, layout may automatically switch to Analyze Layout when monitoring stops.
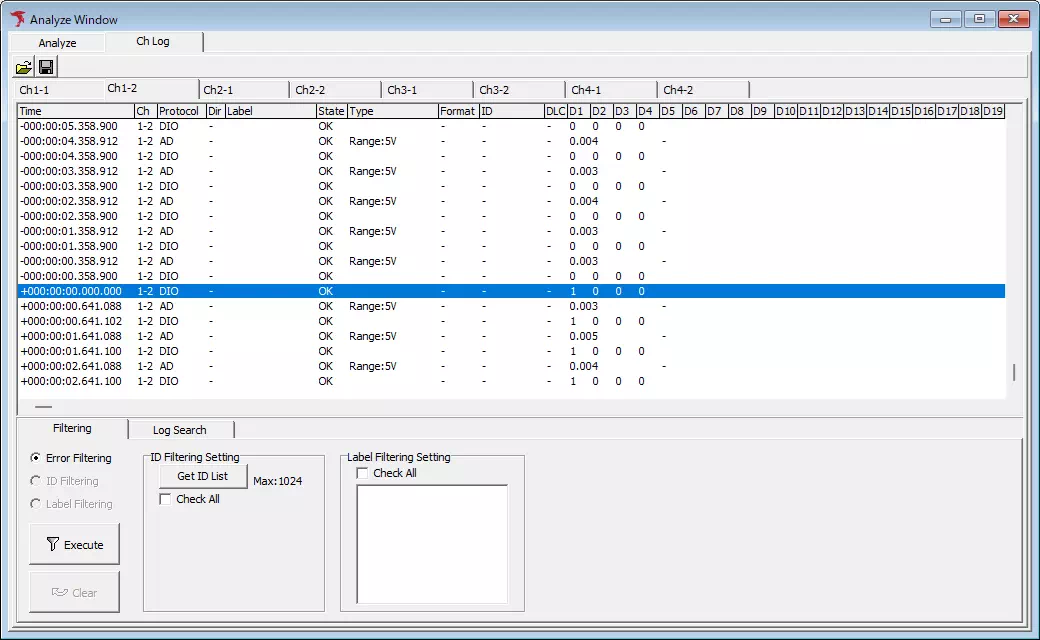
8. Check and Analyze Logs
After stopping monitoring, recorded logs can be displayed and processed in Analyze Window.
This section introduces how to use Search Function and Offset Function.
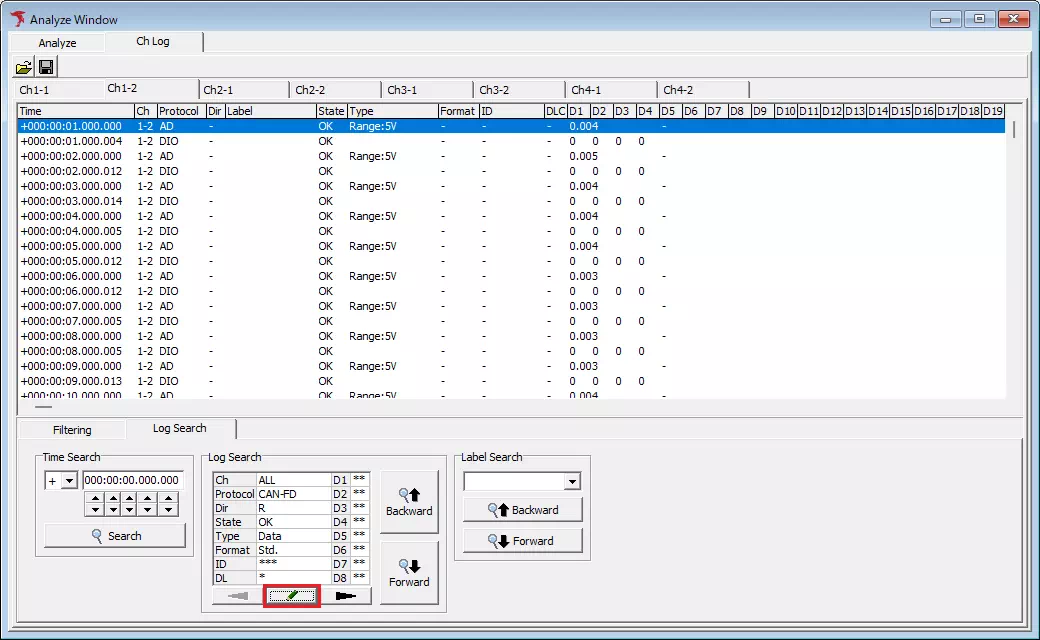
Search Function
Using search, you can find logs matching specific conditions.
Search function is available only for DIO logs. It is not available for A/D logs.
The following explains searching for logs where DIO1 changes from Lo to Hi.
- Open
Log Searchtab, then click the button in
 Log Searcharea.Search Settingdialog appears.
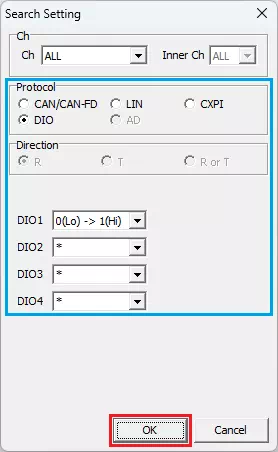
- In
Search Setting, setProtocoltoDIO, setDIO1to0(Lo) -> 1(Hi), setDIO2toDIO4to*, then click.
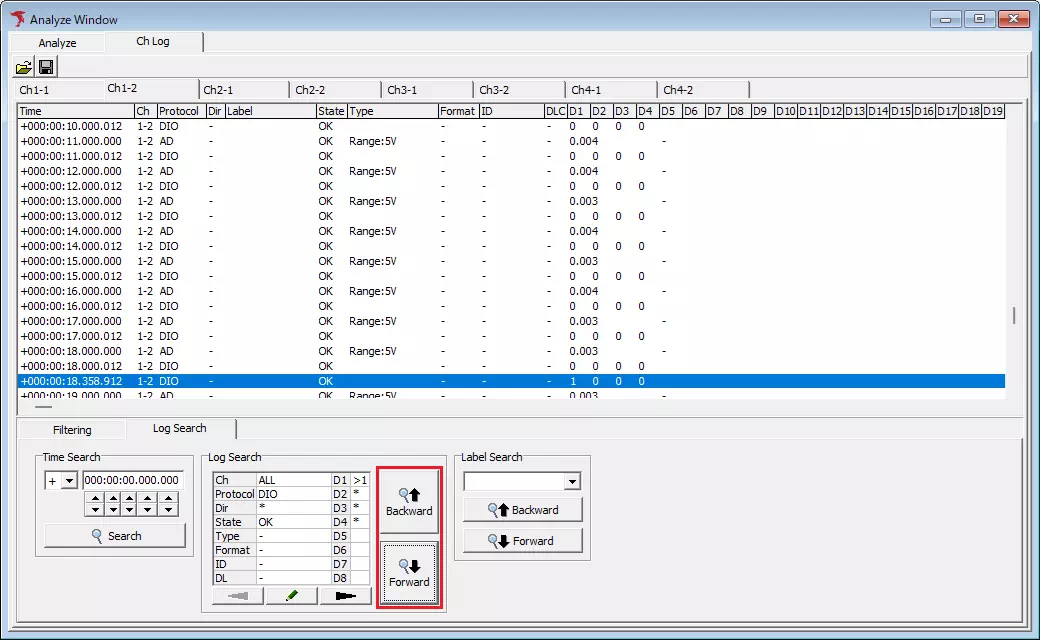
- Click
 or
or  in
in Log Searcharea. Cursor in log display moves to a frame matching the condition set in step 2.
Offset Function
Using offset, you can set a specific log as a reference point and display timestamps of other logs as offset time from that point.
The following explains setting as reference the log where DIO1 changes from Lo to Hi.
- Right-click the log you want to use as the reference point in log display area. Context menu appears.
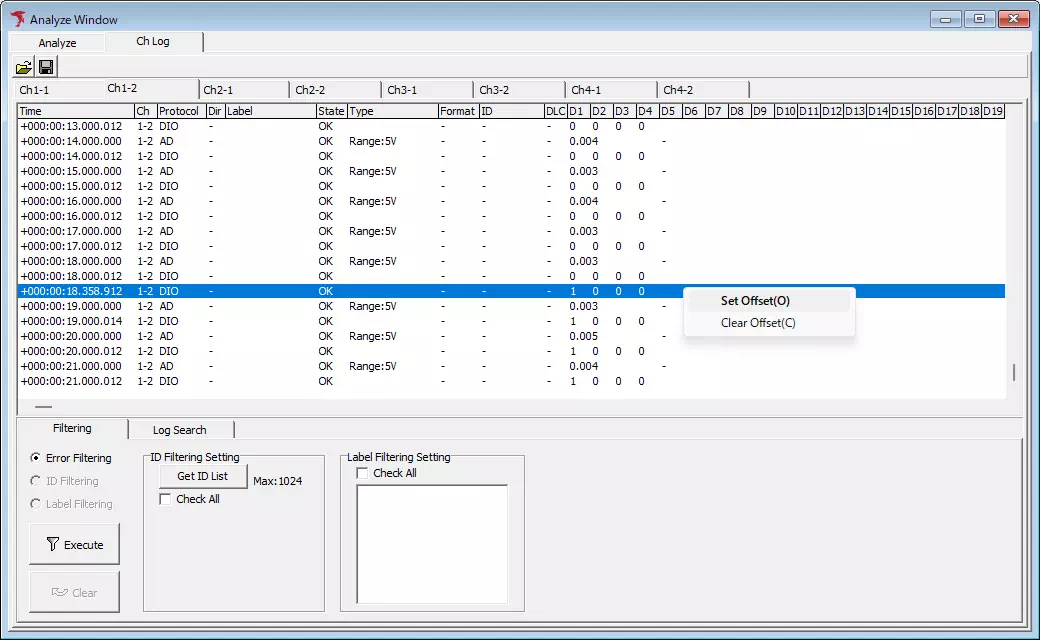
- Select
Set Offsetfrom context menu. Offset is enabled; timestamp of selected log becomes zero and other log timestamps are shown as offset time from the reference point.
To disable offset, select Clear Offset from context menu.
You can also enable offset by double-clicking the log you want as the reference point.