Monitor Window
Monitor Window displays acquired log data in real time during monitoring. Main functions are as follows.
| Function | Description |
|---|---|
| Per-channel tab display | From logs of up to 8 channels, you can select display target channel by tabs. |
| Log view mode selection | Select one of the following: - Signal View: large display for a single channel. - Dual View: side-by-side display for two channels. |
This allows simultaneous monitoring of multiple points.
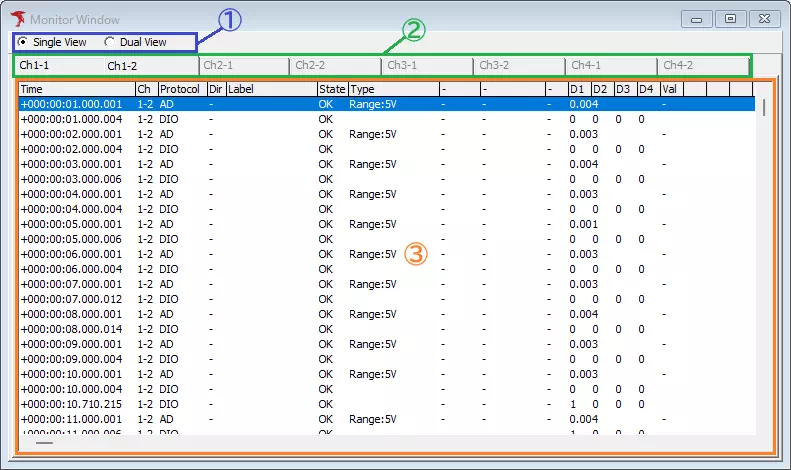
Monitor Window Screen Description
| Item | Description | Notes |
|---|---|---|
| Log view mode setting (Area ①) | Switches log view mode. Options: Single View, Dual View | See Log View Mode. |
| Channel selection tab (Area ②) | When Single View is selected, choose channel to display by tab. | In Dual View, pull-down menus are shown instead of tabs. |
| Log display area (Area ③) | Displays DIO/AD monitoring log data. | See Log Display Area. |
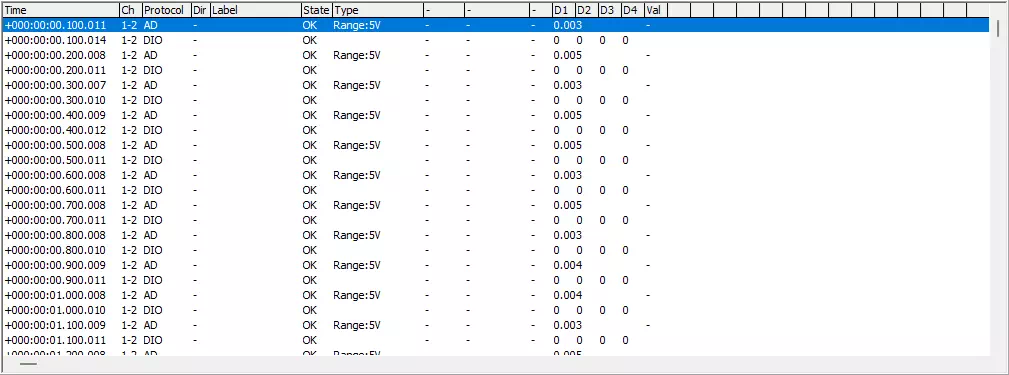
Log Display Area
| Item | Description | Notes |
|---|---|---|
| Time | Shows timestamp of acquisition. | Format follows Time Stamp Form in Option dialog. |
| Ch | Shows channel. | |
| Protocol | Shows protocol. | |
| Dir | Displays - (hyphen). | |
| Label | If frame matches label filter conditions in Label Filter Window, label name is displayed. | See Label Function. |
| State | OK if acquired normally, NG on error. | |
| Type | For AD, shows range setting.For DIO, blank. | Range setting can be changed in Simulation Window. |
| D1 to D4 | For DIO, shows DIO1 to DIO4 levels in D1 to D4 (0=Lo, 1=Hi).For AD, shows measured voltage in D1. | |
| Val | For AD, if physical quantity calculation is enabled, shows calculated result from measured voltage.Otherwise displays -. | Physical quantity calculation is under development and currently unavailable. |
Log View Mode
There are two log view modes: Single View and Dual View. Switch by radio buttons.
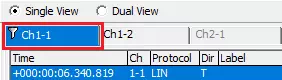
If a channel has Filter Enabled checked in Display Filter Window, a filter icon is shown in channel selector.
Single View
Displays monitoring logs of one channel in log display area. Target channel is selected by tab.
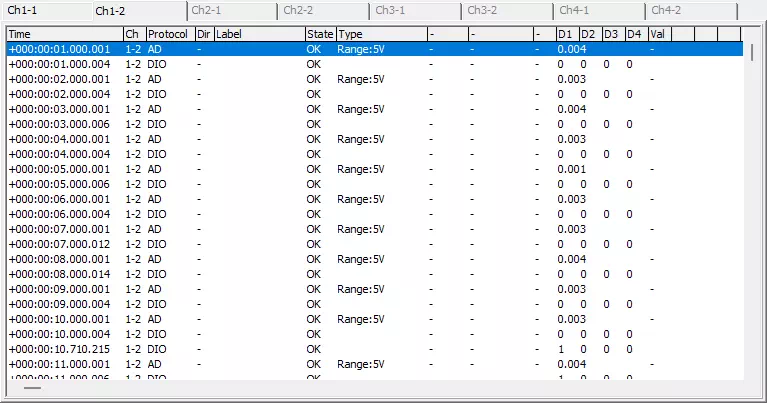
If Filter Enabled in Display Filter Window, filter icon is displayed on channel selection tabs as below.
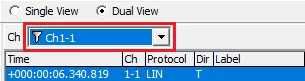
Dual View
Displays monitoring logs of two channels side by side in log display area. Target channels are selected by pull-down menus.
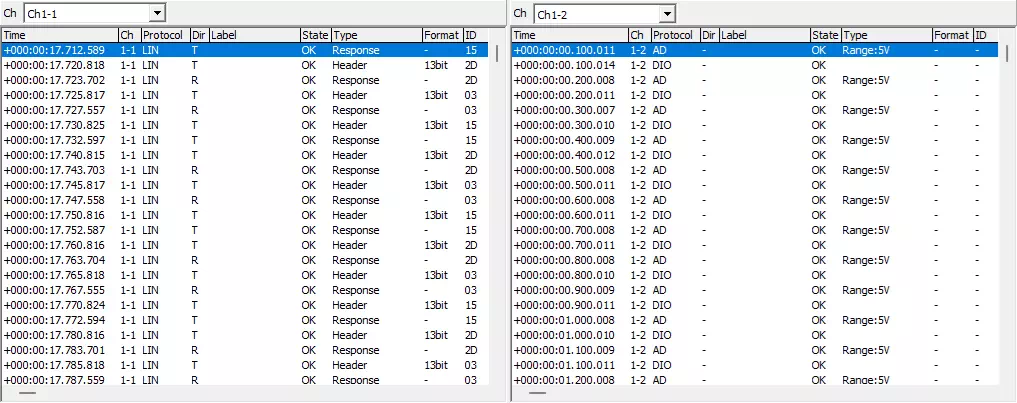
If Filter Enabled in Display Filter Window, filter icon is displayed in channel selection pull-down menus as below.