Option Settings
In the Option dialog, you can fine-tune behavior related to monitoring, log display, and logging.
Procedure
- Open the Option dialog
SelectTool-Optionfrom the menu bar, or click the button on the toolbar.
- Change option settings
Change any setting in the Option dialog, then clickOKto apply.
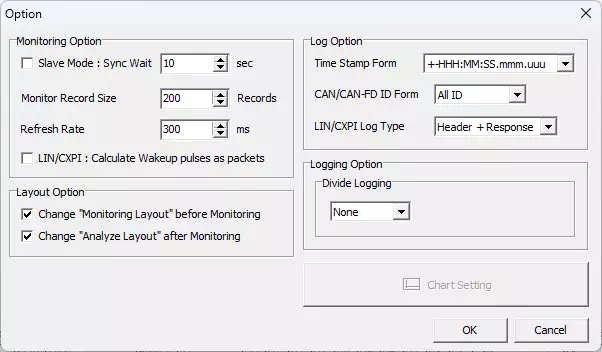
Option Dialog
| Item | Description | Notes | |
|---|---|---|---|
| Monitoring Option | Slave Mode | Enables/disables slave mode. If enabled, the software works as a time-synchronization slave. When put into synchronization-wait state, monitoring starts/stops automatically in sync with the time-synchronization master side (timing error of several tens of milliseconds may occur when stopping). | Use this when operating MicroPeckerX and MicroPecker with time synchronization, or when operating multiple MicroPeckerX units across two PCs and this GUI should run as the time-synchronization slave. |
| Sync Wait | When slave mode is enabled, specifies in seconds the maximum wait time for a synchronization signal from the master after entering synchronization-wait state. Configurable range: 1-60. | If no synchronization signal is received within the specified time, Monitor synchronization error. occurs and synchronization-wait state is canceled. | |
| Monitor Record Size | Sets the maximum number of log records retained and displayed by the Monitor Window. Configurable range: 100-1000. | Using spin buttons changes the value in steps of 100. | |
| Refresh Rate | Sets the redraw interval (display update timing) for each GUI window in milliseconds. Configurable range: 100-1000. | Using spin buttons changes the value in steps of 100 ms. | |
| LIN/CXPI : Calculate Wakeup pulses as packets | For LIN/CXPI communication, specifies whether wakeup signals are included in packet counts shown in Monitor Window Status. [ON] Include wakeup signals in packet count. [OFF] Do not include wakeup signals in packet count. | This setting is not reflected in Status after monitoring has stopped. | |
| Layout Option | Change "Monitoring Layout" before Monitoring | Specifies whether to automatically change layout when monitoring starts. [ON] Switch to Monitoring Layout when monitoring starts.[OFF] Do not change layout when monitoring starts. | |
| Change "Analyze Layout" before Monitoring | Specifies whether to automatically change layout when monitoring stops. [ON] Switch to Analyze Layout when monitoring stops.[OFF] Do not change layout when monitoring stops. | ||
| Log Option | Time Stamp Form | Sets the timestamp display format for log records. Choices: +-HHH:MM:SS.mmm.uuu, +-SSSSSSS.mmmuuu | This setting is also applied when saving log files. If a log file saved with a different setting is loaded, the timestamp display format is automatically converted to the current setting. |
| CAN/CAN-FD ID Form | Sets the display format of IDs in CAN extended format. [ALL ID] Displays SID and EID as one continuous 29-bit value (upper 11 bits: SID, lower 18 bits: EID). [SID/EID] Displays SID and EID separately (left: SID, right: EID). | This setting is also applied when saving log files. If a log file saved with a different setting is loaded, the log ID display format is automatically converted to the current setting. | |
| LIN/CXPI Log Type | Sets the display format for LIN/CXPI logs in Monitor Window, Each ID Window, and Analyze Window. [Header + Response] Displays header and response separately. Log Type becomes Header and Response.[LIN/CXPI Frame] Displays header and response as one frame. Log Type becomes LIN Frame or CXPI Frame. | This setting is also applied when saving log files. However, if a log file saved with a different setting is loaded, the log display format is not converted. Also, changing this setting does not affect logs currently displayed in each window. | |
| Logging Option | Divide Logging | Sets whether log files are automatically split under certain conditions. [None] No automatic split. [FileSize] Split when file size reaches threshold (1-4095 MB). [Record] Split when record count reaches threshold (100-2500000). [Time] Split when elapsed time from logging start reaches threshold (1-3600 seconds). | Applies only to log files automatically saved during monitoring. |
| Chart Setting | Configures graph display settings. | This function is under development and currently unavailable. | |