Getting Started with Signal Monitoring
Feature Overview
The signal functions of MicroPeckerX LIN Analyzer Plus convert LIN frame data into values such as speed, temperature, and state for display in Signal Window. Use them together with monitoring functions that show frame IDs and data bytes.
Terminology and Setting Relationships
For terminology and the relationships between definitions, Sets, and their uses, see Catalog Roles and Terminology.
Preparation
- Connect the device and configure communication.
- Stop monitoring. If definition editing is disabled, check whether analysis is running.
- Prepare the sample LDF. To test reception, you need a master that sends headers and a node that returns a 2-byte response to ID 0x10. Set Simulation to None for reception-only monitoring.
Basic Operations
This procedure registers Speed and State in a Set named LIN Sensor and checks their values on CH1-1. Figures 5 and 6 show display settings that also use a graph; Figures 7–9 are a separate display example checking Values and Status Monitor without a graph.
1. Open Signal Catalog
Open “Signal Window” using the window tabs at the top, then click the “Signal Catalog” button in Figure 1. You can also open it using “Signal Catalog” on the main toolbar. Select the Set to use under Signal Sets on the left of the Catalog. To create one, click + at the bottom left, enter a name, and confirm. This procedure names the Set LIN Sensor. Figure 1 shows the created Set selected in the Signal Set field.
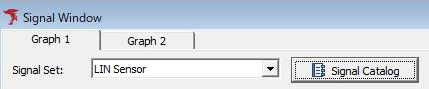
Figure 1. Opening the Catalog using the Signal Catalog button in Signal Window.
2. Register Signal Definitions
Prepare the sample LDF and select it using “Import.” Under Signals in Figure 2, SensorFrame with ID 0x10 and Speed and State appear under SensorNode. Also check SensorFrame and SensorSchedule in Frames and LIN Schedules, then click “Import.” See Importing Communication Definition Files for details. Without a file, you can register signals manually using “+ Signal.”
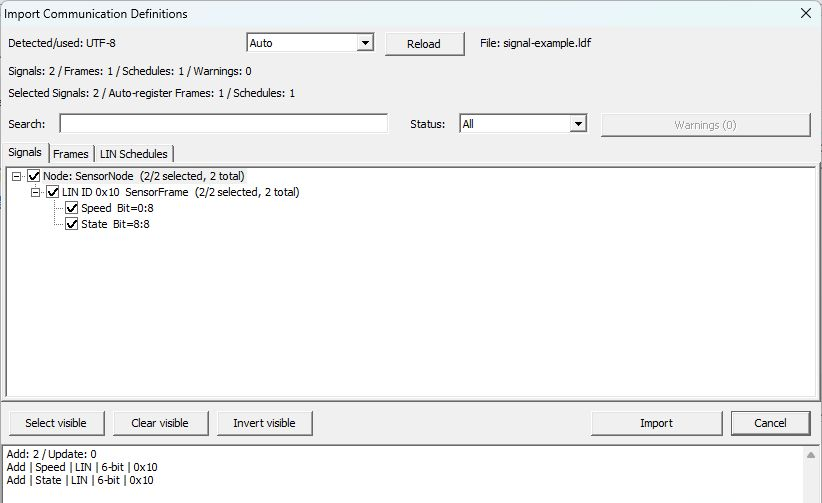
Figure 2. Import preview of signal-example.ldf.
3. Add Signals to the Set and Assign a Channel
Turn on “In Set” for Speed and State in the Signals list. When Assign Channel appears, select the actual channel to use and click “OK” (Figure 3). This example uses CH1-1. If CH remains Unassigned, check the assignment in the signal settings screen.
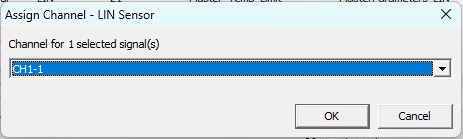
Figure 3. Selecting CH1-1 for signals added to LIN Sensor.
Check that Speed and State have In Set ON and CH CH1-1, as in Figure 4. Also compare Protocol LIN, ID (Hex) 10, and Message SensorFrame. When “Only selected Set” is ON, only signals belonging to the selected Set are shown.

Figure 4. Set membership and channel assignments for LIN Sensor. Monitor for the value display configured in step 4 is ON; Graph is not used.
4. Configure Display Targets and Graphs
Select the target signal, click “Edit,” and turn on “Values” under “Conversion / Display.” Selecting LIN Sensor in Signal Window lets you check value display targets in the Monitor column of Display Settings (Figure 5). Enable both Speed and State. Also check imported conversion definitions and units in the editing screen. In this example, Speed uses Raw × 0.5 − 5 with unit km/h.
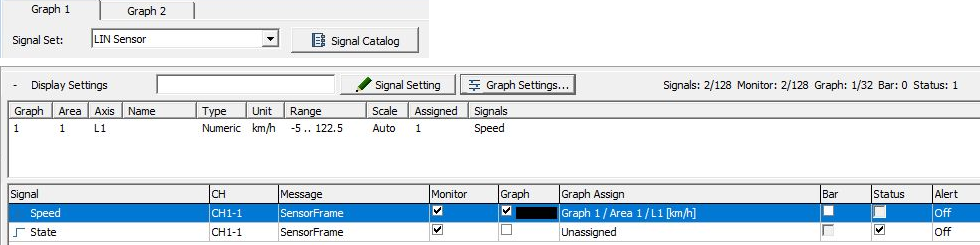
Figure 5. Checking display destinations in LIN Sensor's Display Settings.
In Figure 5, Monitor and Graph are ON for Speed, Monitor and Status are ON for State, and Bar is OFF for both. Unassigned in State's Graph Assign indicates that its graph destination is unassigned. Both signals use CH1-1.
To display a waveform as well, turn on “Graph,” open the “Graph” button, and check Speed in Graph 1, Area 1 (Figure 6). Check that Graph 1 assignments shows A1 L1 and the axis on the right shows km/h, then confirm each dialog with “OK.” To also show State's state name in Status Monitor, see Signal Settings.
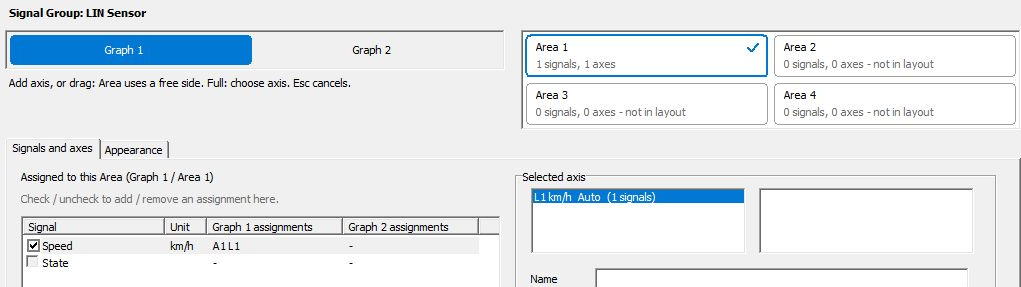
Figure 6. Example assignment of Speed to the left axis of Graph 1, Area 1 in LIN Sensor.
Figures 5 and 6 are settings examples that also use Speed's graph. Figures 7–9 below are a separate display example comparing Values and Status Monitor without Graph. Figure 6 checks assignment settings; it is not a waveform from actual communication. For axes and display ranges, see Graph Display Settings.
5. Select the Set to Use
Use “Set Current” in the Catalog to make the target Set Current. Figure 4 shows LIN Sensor [Current]. Click “Close,” then open “Signal Window” using the window tabs at the top. Check the target signals and channels in the Signal Set field, signal list, and Details.
In Figure 7, Signal Set is LIN Sensor, and the central signal list shows Speed and State with CH1-1. Selecting Speed shows Protocol LIN, ID 0x10, DL 2, and Message SensorFrame in Details. Check that both signals also appear in Values on the right. State's Status Monitor is an additional display destination in this example.
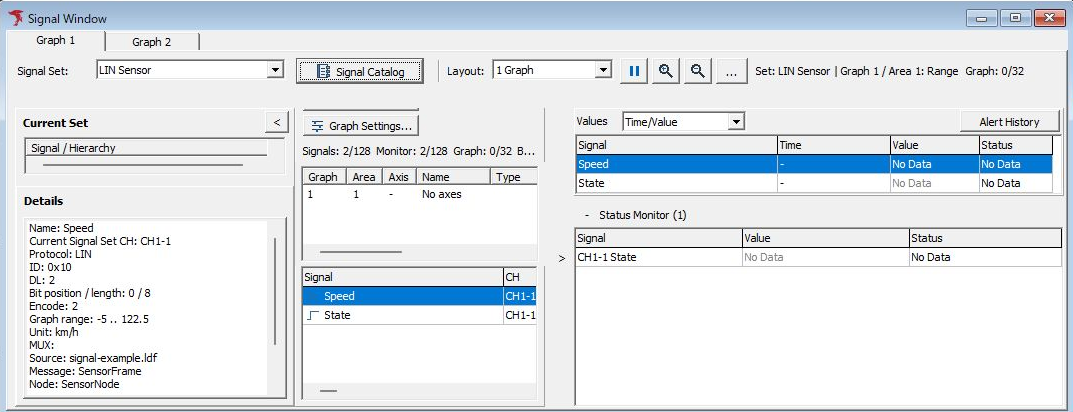
Figure 7. Checking the Set, channels, and signals in LIN Sensor before monitoring.
No Data and “-” in Figure 7 indicate that values have not been acquired. Graph is not used, so Graph Settings shows No axes.
The Catalog retains individually confirmed additions, edits, and membership changes. “Close” does not undo the series of changes. To keep them in a file, use “Save” in the Catalog to save an MPXSIG file.
6. Start Monitoring and Check Values
Start using “Command” → “Start,” the toolbar Start button, or F5. Once response data for the target frame is acquired, values appear at the configured destinations. Compare IDs, data lengths, and data in Monitor Window or Each ID Window against values in Signal Window.
In LIN, receiving only a header does not acquire values for signals that use response data. Check that the target node is responding.
Figures 8 and 9 show actual transmission and decoding of ID 0x10 with data “1E 01” every 100 ms, with CH1-1 configured as Tx in Master Sim. to verify the sample definitions. Immediately after applying SensorSchedule from the LDF, the slot is Rx to receive responses from SensorNode; this capture changes it to Tx for transmission. When monitoring reception from a connected node, use definitions and an operating mode matching the peer's ID, data length, and channel.
In Figure 8, Values shows Speed 10 km/h and State On, with Status Received for both. State's Status Monitor also shows On and Defined. Check transmission/reception direction in the source frame's Dir.
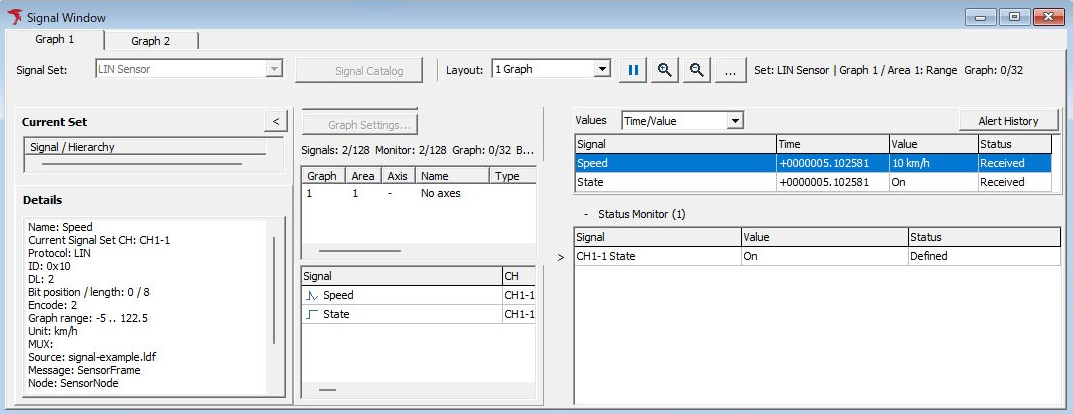
Figure 8. Signal Window decoding actual transmitted data for ID 0x10.
Check the source data at the same timestamp in Each ID Window in Figure 9. The Response row has Dir T, ID 10 (hexadecimal 0x10), DLC 2, D1 1E, and D2 01. Response time +0000005.102581 matches Time in Values in Figure 8. Speed converts Raw value 30 to 10 km/h, and State converts Raw value 1 to On, confirming the correspondence between source bytes and signal values.

Figure 9. Response data 1E 01 at the same timestamp as Signal Window.
Stop using “Command” → “Stop,” the Stop button, or F6. Pausing the graph is a display operation, not a stop of monitoring as a whole. After stopping, save to MPXSIG using Save in the Catalog, and keep the LDF and communication log used together with it.
Examples Used in This Chapter
The sample LDF defines the following 2 signals. Download it and import it using Import in the Catalog. Importing alone does not start transmission.
| Item | Speed | State |
|---|---|---|
| Frame | SensorFrame, ID 0x10, 2 bytes | Same as left |
| Bit position | Bit Position 0, Data Length 8 | Bit Position 8, Data Length 8 |
| Byte order / signedness | Little Endian, unsigned | Little Endian, unsigned |
| Conversion | Raw × 0.5 − 5, unit km/h | Raw 0: Off; Raw 1: On |
When the first 2 data bytes are “1E 01”, Speed has Raw value 30 and physical value 10 km/h, while State is On. Compare this correspondence in Figures 8 and 9. Actual monitored values depend on frames from the connected node.
Checks When Nothing Is Displayed
- Check Current Set, and the signal's In Set setting and channel assignment.
- Check in Monitor Window that the target ID, data length, and data are being received.
- Compare definitions such as Protocol, Direction, and ID with the frame.
- Check display targets such as Values/Graph and the graph assignments.
- Check bit positions, conversion formulas, and multiplexing conditions.
See Checking the Signal Window Display for details.
For saved-log analysis, result output, and use in transmission settings, see the respective instructions.