Defining Bus Signals Manually
Overview
Use manual definition when no definition file is available or when you want to add or check a signal manually. If you have an LDF, you can start by importing communication definitions. Signal Setting configures how to extract values from frames, convert them, display them, and generate alerts. Add a signal with “+ Signal” in the Catalog, or open a registered signal with “Edit.”
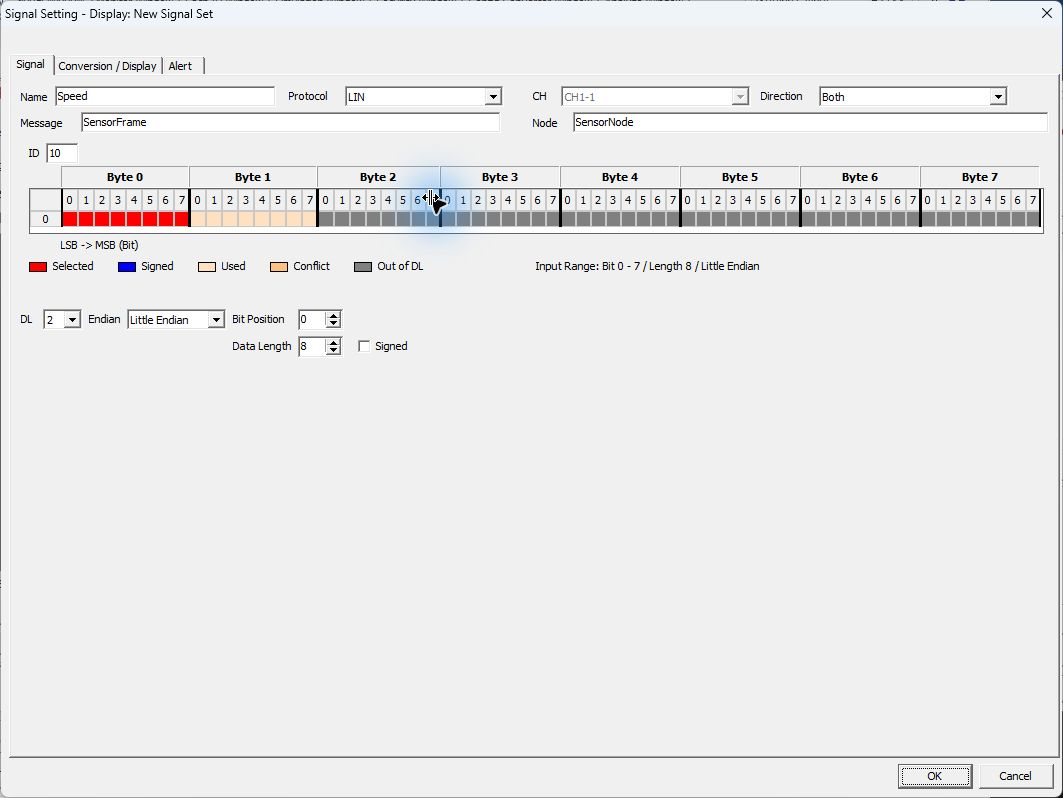
Figure 1. Signal tab with Speed from the sample LDF open.
Figure 1 shows Speed opened in New Signal Set. The 8 bits of Byte 0 are selected, and State is defined in Byte 1. Areas outside DL are gray.
Basic Manual Registration Procedure
- Select the target Set in Signal Catalog and click “+ Signal.”
- Configure Name, Protocol, CH, Direction, ID, DL, and other settings.
- Configure Endian, Bit Position, Data Length, and Signed, and check the range in the bit diagram.
- Configure conversion and display destinations under Conversion / Display.
- If needed, configure monitoring conditions on the Alert tab.
- Click OK, then check In Set, channel, and display settings in the Catalog.
Distinguish the signal definition from per-Set channel and display settings. Check the Set shown in the screen title. Editable items may differ for signals that exist only in the Catalog or have an unavailable channel.
Signal Tab Reference
| Item | Description |
|---|---|
| Name | Signal name. Identify signals using the channel and ID as well as the name. |
| Protocol | Select LIN. |
| CH | Actual channel associated with the signal. Check the channel used in the Set. |
| Direction | Target transmission/reception direction. Both includes both directions. |
| Message / Node | Check frame names, node names, and other information obtained from communication definitions. |
| ID | Specify the frame ID in hexadecimal. Do not confuse the LIN ID with the PID notation that includes parity. |
| DL | Frame data length in bytes, distinct from the signal's bit length. |
| Endian | Select Little Endian or Big Endian extraction. |
| Bit Position | Specify the signal's start bit position. |
| Data Length | Specify the signal's number of bits. |
| Signed | Turn on to treat the value as a signed number. |
| Bit diagram | Check positions and overlaps using the Selected, Signed, Used, Conflict, and Out of DL colors. |
Example: Extracting the First Byte as a Number
To use the first byte of a LIN frame with ID 0x10 and DL 2, set Little Endian, Bit Position 0, Data Length 8, and Signed OFF. For data “1E 01 …”, the Raw value is hexadecimal 1E = decimal 30.
For Big Endian signals or signals crossing byte boundaries, compare the bit numbering in the signal specification with the bit diagram. Changing only Endian does not necessarily make the same start bit refer to the same range.
Conversion / Display Tab
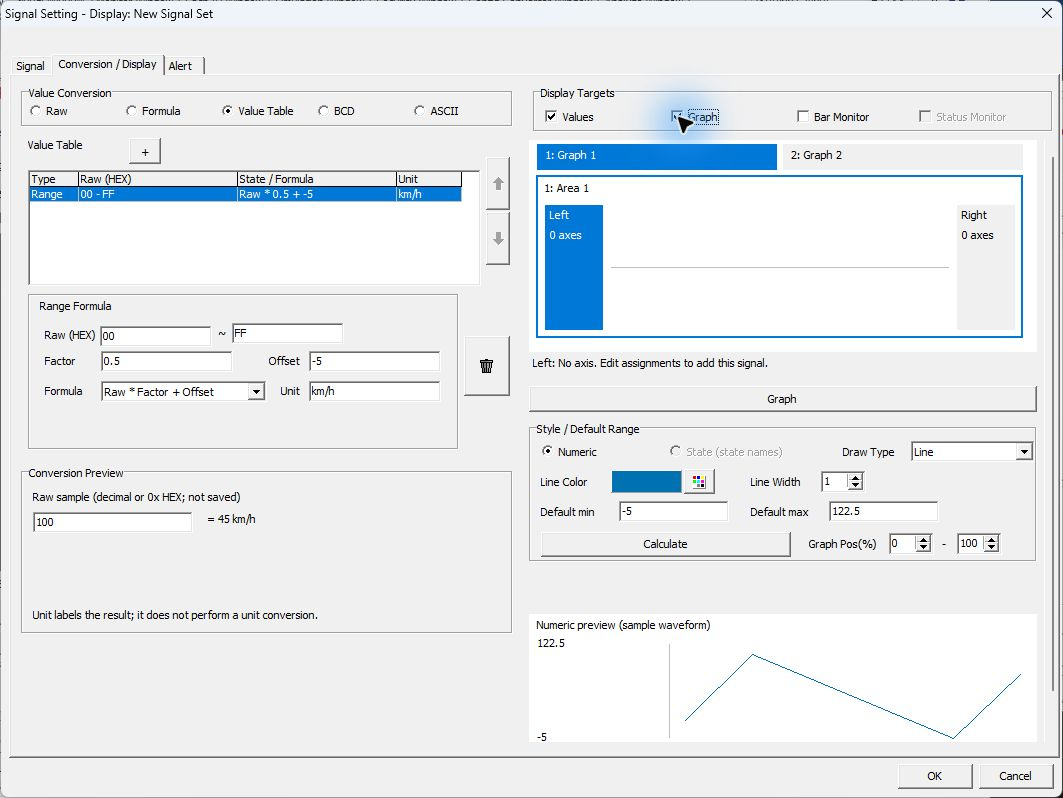
Figure 2. Configuring Speed conversion and display destinations in Conversion / Display.
In Figure 2, Speed conversion settings are on the left and graph display settings are on the right. The 100→45 km/h Conversion Preview and the sample waveform below are for checking settings, not actual measurements.
Value Conversion
| Option | Description |
|---|---|
| Raw | Uses the extracted value without conversion. |
| Formula | Converts to a numeric value using a formula with a factor, offset, or other operations. |
| Value Table | Defines conversions for Raw ranges or state names corresponding to Raw values. |
| BCD | Converts data represented as BCD. |
| ASCII | Treats data as a string. Set the signal length in bytes. |
Use + in Value Table to add a row, then configure its Raw range, Factor, Offset, Formula, Unit, state name, and other properties. Use the up/down buttons to adjust the order; select and delete unwanted rows.
Different formula types can produce different results with the same Factor and Offset. Check the selected Formula and Conversion Preview to avoid confusing, for example, “Raw × Factor + Offset” with “(Raw + Offset) × Factor.”
Unit is the name of the displayed unit. Changing Unit alone does not convert values. To convert km/h to m/s, also configure the conversion formula.
Display Destinations
| Item | Description |
|---|---|
| Values | Includes the signal in the value list. Shown as Monitor in Display Settings in Signal Window. |
| Graph | Enables waveform display. Use the Graph button to configure destinations and shared axes. |
| Bar Monitor | Displays a numeric value as a bar. Availability depends on the signal. |
| Status Monitor | Displays a state. Availability depends on the signal's conversion settings. |
| Style / Default Range | Configures line type, color, width, numeric/state rendering, default display range, and related settings. |
When editing a signal in a Set, use Auto color in Graph display or the Bar settings to assign the same color to the signal in Graph and Bar Monitor. Color and display range are separate settings. Check the Bar range and the Graph shared axis range independently. For the Bar range, choose whether to use the range from the definition or enter a custom range.
Example: Displaying State in Status Monitor
State in the sample LDF uses the second byte of SensorFrame (ID 0x10, DL 2). This example uses CH1-1 in a Set named LIN Sensor. This differs from New Signal Set in Figures 1 and 2, so check the Set and signal name being edited.
- Select the target Set and State in the Catalog and open “Edit.” To define it manually, set Name to State, Protocol to LIN, ID to 10 (hexadecimal), DL to 2, Endian to Little Endian, Bit Position to 8, Data Length to 8, and Signed to OFF. The channel used is CH1-1.
- Select Value Table under Value Conversion in Conversion / Display. As in Figure 3, use rows with Type State to map Raw (HEX) 00 to Off and 01 to On. Check state names in the State / Formula column. If imported from the sample LDF, check that these 2 rows are registered.
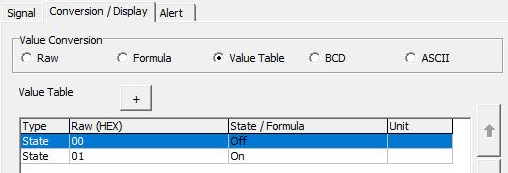
Figure 3. Defining 00→Off and 01→On in State's Value Table.
- Turn on Values and Status Monitor under Display Targets (Figure 4). Graph is OFF in this example. Confirm with “OK,” check State's In Set setting and channel in the Catalog, make the target Set Current, and open Signal Window.

Figure 4. Enabling Values and Status Monitor for State.
- Start monitoring, acquire the target response data, and check State's state name. For data “1E 01”, the second byte 01 corresponds to State's Raw value 1, giving On. In Figure 5, CH1-1 State in Status Monitor has Value On and Status Defined. State in Values also shows On with Status Received.
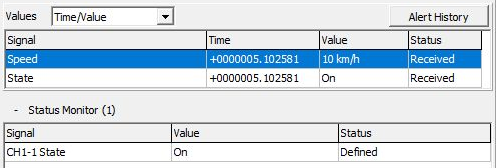
Figure 5. Checking the configured state name On in Signal Window.
Status Received in Values means signal data has been acquired. Defined in Status Monitor means that a state name is defined for the acquired Raw value. If no value has been acquired, No Data appears. For a detailed before/after comparison, see Checks During Monitoring in Signal Window.
Figure 5 shows decoded data from actual transmission of ID 0x10 with data “1E 01” every 100 ms using Master Sim. on CH1-1. The same frame gives Speed 10 km/h and State On, with matching Time +0000005.102581 for both signals. Check direction and source bytes against the Response row (Dir T, D1 1E, D2 01) in Figures 8 and 9 of the basic operations. Unlike the Conversion Preview in Figure 2, Figure 5 shows the result of this actual transmitted data.
Example: Comparing Speed's Raw Value, Conversion, and Monitored Value
Figures 5–7 use the same LIN Sensor settings and actual transmission example. Check Speed's conversion in the Conversion Preview in Figure 6, then compare the monitored value with Values in Figure 5 and the source frame in Figure 7.
- On the Signal tab, check CH1-1, Protocol LIN, ID 10 (0x10), DL 2, Little Endian, Bit Position 0, Data Length 8, and Signed OFF. The first byte's 8 bits are Speed's Raw value.
- Select Value Table in Conversion / Display and check that the row for Raw (HEX) 00–FF uses Formula
Raw * Factor + Offset, Factor 0.5, Offset -5, and Unit km/h. - Enter
0x1Ein “Raw sample (decimal or 0x HEX; not saved)” in Conversion Preview. Hexadecimal 1E is decimal 30, and30 × 0.5 − 5 = 10, so the result is= 10 km/h.
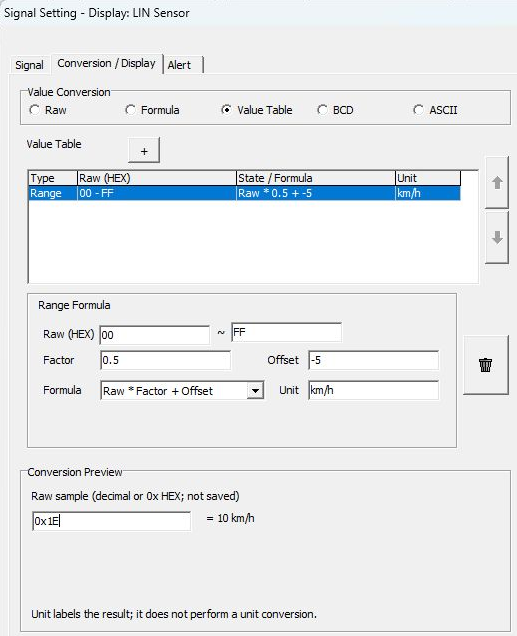
Figure 6. Checking Speed conversion using the same Raw value as the actual frame.
The preview calculates the entered sample value; it is not acquired from communication. The Raw sample input is not saved either. Compare actual monitored values against the frame log and Values at the same timestamp.

Figure 7. Checking first byte 1E, which corresponds to Speed's Raw value.
The Response in Figure 7 has Time +0000005.102581, Dir T, ID 10, DLC 2, D1 1E, and D2 01. Values in Figure 5 has the same Time, with Speed 10 km/h and State On. This compares the Raw value, calculated result, and monitored value from data “1E 01” transmitted as Tx every 100 ms using Master Sim. on CH1-1.
Confirming, Canceling, and Saving
OK confirms this edit. Cancel discards unconfirmed changes in this editing dialog. It does not undo other edits already confirmed in the Catalog. To save to a file, use Save in the Catalog.