Getting Started with Signal Monitoring
Feature Overview
The signal features in MicroPeckerX CAN FD Analyzer convert CAN/CAN FD frame data into values such as speed, temperature, and status, and display them in Signal Window. Use these features together with the monitoring features for checking frame IDs and data bytes.
| Feature | Description |
|---|---|
| Signal definitions | Configure frame conditions, bit positions, byte order, signedness, and value conversion. |
| Import communication definitions | Import signal and frame definitions from DBC files. |
| Signal Set | Manage combinations of signals, channels, and display settings. |
| Value and waveform display | View values in a list, graphs, numeric bars, and status displays. |
| Derived signals | Display results calculated from registered signals. |
| Alerts | Detect value conditions or missing reception, and review activation and recovery in the history. |
Terminology and Setting Relationships
See Signal Catalog for terminology and the relationships between the Catalog, Sets, and channels.
Preparation
- Connect the device and configure communication.
- Stop monitoring. If definition editing is disabled, check whether analysis is running.
- Prepare a DBC for the target bus. A source that actually transmits the target frames, such as another node, is required. The screenshots in this chapter show reception of a CAN FD frame from FanDemo_CANFD.dbc (standard ID 0x310, 16 bytes) on CH1-1.
Basic Operations
The examples check Target_RPM_demo (rotational speed) and Fan_Phase_demo (operating state) in the Signal Set “FD2 2CH - Manual.” Other configured signals and graphs are also visible in the screenshots.
1. Open Signal Catalog
Click “Signal Catalog” (outlined in red) on the left side of the main toolbar. It is above the window-switching tabs, immediately to the right of the file operation buttons.

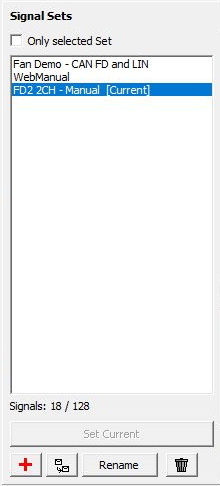
When the Catalog opens, select the Set to use under Signal Sets on the left. To create a Set, click the + button at the lower left, enter a name, and confirm. The Signals list on the right shows registered signals.
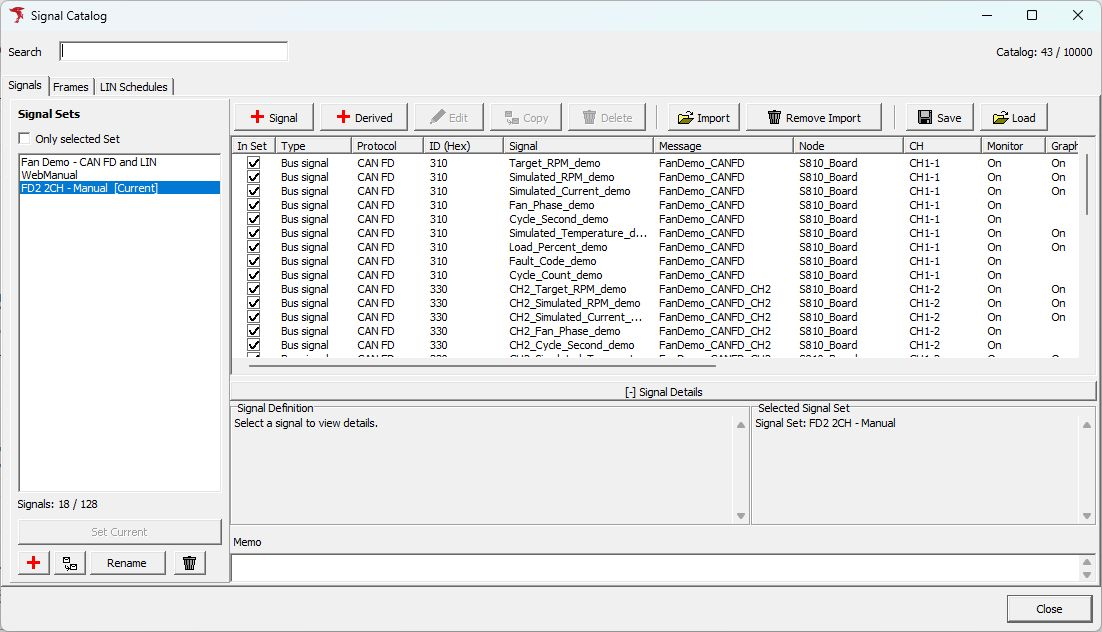
2. Register Signal Definitions
Click “Import” (outlined in red) at the upper right of the Catalog and select FanDemo_CANFD.dbc.

All signals are initially selected in the import preview. To select only the two signals shown, remove any filters on the Signals tab and click “Clear visible.” Expand ID 0x310 “FanDemo_CANFD” under “S810_Board” and select Target_RPM_demo and Fan_Phase_demo. Check that “Selected Signals: 2” is displayed, then click “Import.” Importing alone does not start transmission.
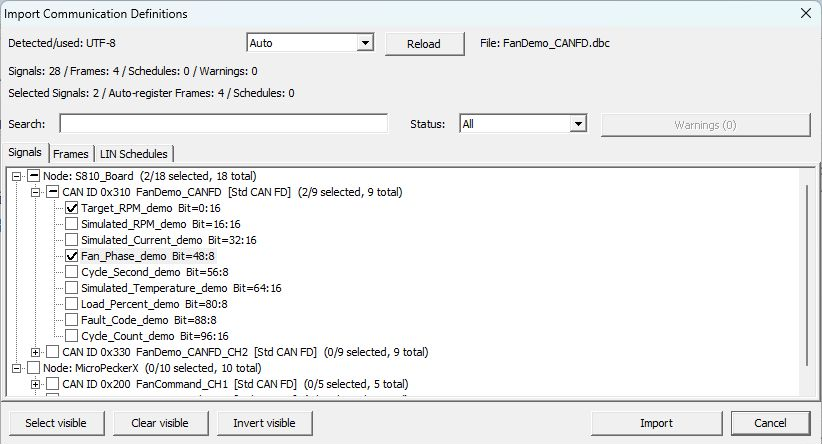
See Importing Communication Definition Files for details. If no file is available, use “+ Signal” to register signals manually.
3. Add Signals to the Set and Assign a Channel
Turn on “In Set” for Target_RPM_demo and Fan_Phase_demo in the Signals list. When Assign Channel appears, select the channel you actually use and click “OK.” This example uses CH1-1.
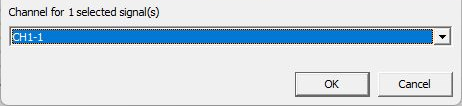
Back in the Catalog, check that “In Set” is on, the ID is 310, and CH is CH1-1 for the target signals. If CH is still Unassigned, check the assignment in the signal settings.
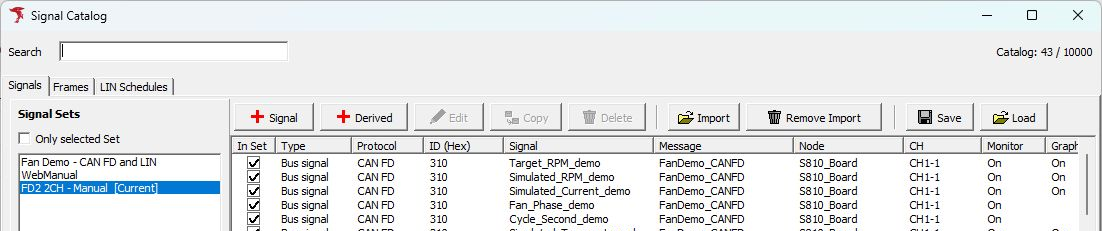
4. Enable Value Display
Select Target_RPM_demo and click “Edit.”

Under Display Targets on the “Conversion / Display” tab, turn on “Values” and click “OK.” Use the same procedure to turn on Values for Fan_Phase_demo. To also show the operating state in Status Monitor as in step 6, turn on “Status Monitor” for Fan_Phase_demo.

If you also need waveforms, proceed to Graph Display Settings.
5. Select the Set to Use
Select the target Set on the left of the Catalog and click “Set Current.” Check that “[Current]” appears after the Set name, then click “Close.” “Set Current” is disabled for a Set that is already Current.
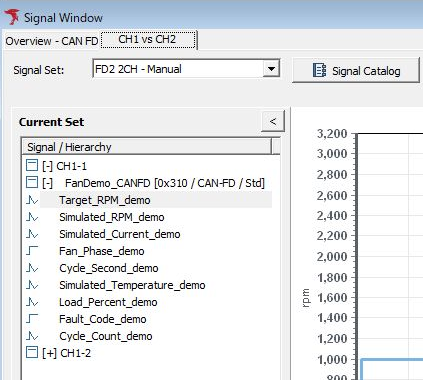
Open “Signal Window” using the window tabs at the top. Check that the Signal Set field shows the target Set and that its signals appear under CH1-1 in Current Set. You can also switch to another Set using the Signal Set field.
The Catalog retains individually confirmed additions, edits, and membership changes. “Close” does not undo the series of changes. To keep them in a file, use “Save” in the Catalog to save an MPXSIG file.
6. Start Monitoring and Check Values
Start using “Command” → “Start,” the red triangular start button on the toolbar (outlined in red), or F5.

When target data frames arrive from the other node, values appear at the configured display destinations.
First, check in Monitor Window that frames with standard ID 310, CAN-FD, and data length 16 are received on CH1-1. The image below shows the last four log rows. In the selected row, CH “1-1,” Protocol “CAN-FD,” and Direction “R” appear after the time. The central red outline highlights ID “310” and the first two bytes “98 0B” after Length “16.”

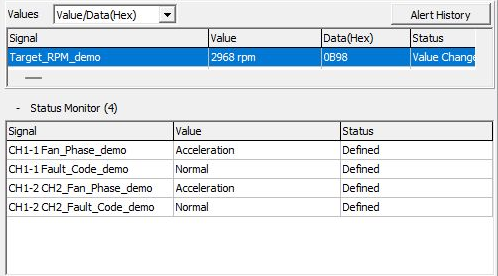
Next, select Target_RPM_demo in Signal Window and check Values. In this example, “98 0B” is 0x0B98 in Little Endian and converts to 2968 rpm. The image also shows Fan_Phase_demo as Acceleration in Status Monitor. Actual values change according to received frames.
7. Stop and Save the Definitions
Stop using “Command” → “Stop,” the blue square stop button on the toolbar (outlined in red), or F6.

Open Signal Catalog and click “Save” at the upper right.

In the save dialog, enter a file name (for example, fd2-fan-monitor.mpxsig) and click “Save.” The entire Catalog and all Sets are saved.

Calculation Example Using the Included Sample DBC
The sample DBC defines Speed and State in SensorFrame. This section demonstrates conversion using a different definition from FanDemo above. After downloading it, import it using Import in the Catalog.
| Item | Speed | State |
|---|---|---|
| Frame | SensorFrame, 8-byte CAN frame, ID 0x100 (standard ID) | Same as Speed |
| Bit position | Bit Position 0, Data Length 8 | Bit Position 8, Data Length 8 |
| Byte order / signedness | Little Endian, unsigned | Little Endian, unsigned |
| Conversion | Raw × 0.5 − 5, unit km/h | Raw 0: Off; Raw 1: On |
If the first two data bytes are “1E 01,” the Raw value of Speed is 30, its physical value is 10 km/h, and State is On. This is a calculation example for checking the definitions. Actual received values depend on frames from the connected device.
Checks When Nothing Is Displayed
- Check Current Set, and the signal's In Set setting and channel assignment.
- Check in Monitor Window that the target ID, data length, and data are being received.
- Compare definitions such as Protocol, Direction, and ID with the frame.
- Check display targets such as Values/Graph and the graph assignments.
- Check bit positions, conversion formulas, and multiplexing conditions.
See Checking the Signal Window Display for details.
For saved-log analysis, result output, and use in transmission settings, see the respective instructions.