Signal Window Screen and Display Operations
Overview
Signal Window displays values, waveforms, and states from Current Set. Select “Signal Window” using the window tabs at the top. First prepare signal definitions and channels using the basic operations.
Screen Layout
This example monitors two channels in FanDemo. CH1-1 and CH1-2 in the tree are channels 1 and 2 of the FD2 connected in this example. The upper left and upper right show target/actual rotational speeds for CH1 (ID 0x310) and CH2 (ID 0x330); the bottom shows current and temperature for each channel. Look at the right side for the value list and bars.
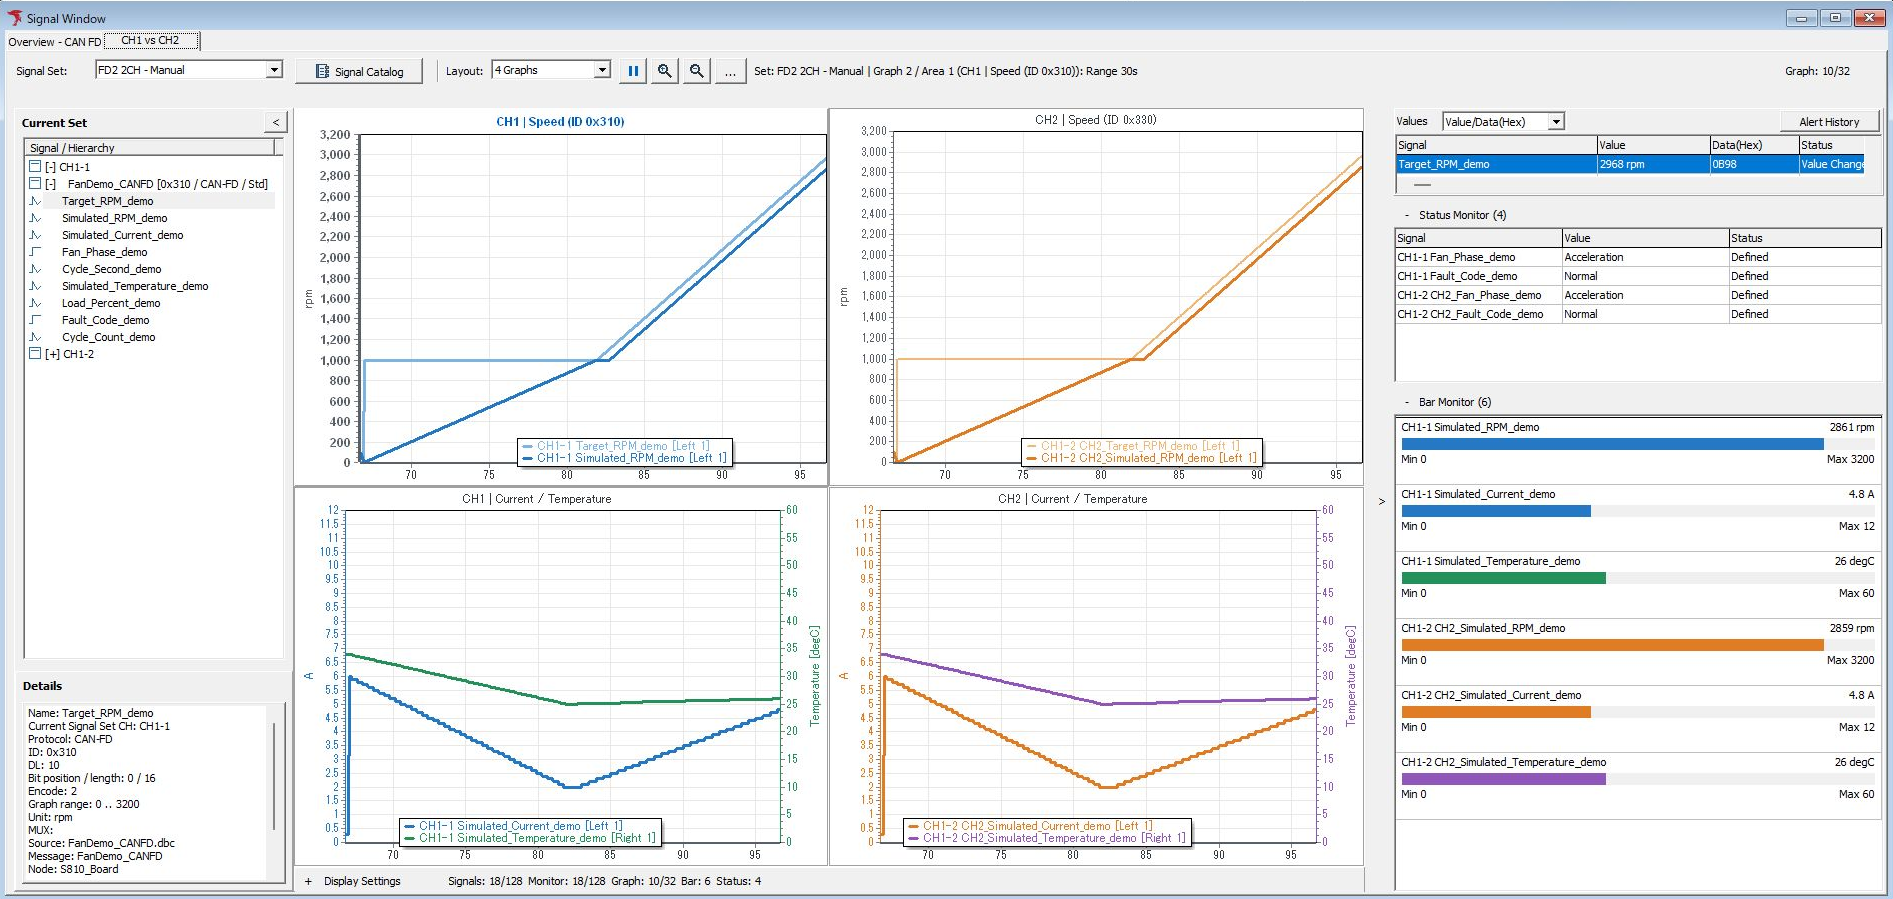
Figure 1. Signal Window showing rotational speed, current, and temperature for two channels.
| Location / item | Description |
|---|---|
| Graph 1 / Graph 2 | Switch graph tabs. Names can be changed in settings. |
| Signal Set | Shows the current Set. To switch Sets, select the target in Signal Catalog and click Set Current. |
| Signal Catalog | Configure definitions, Sets, membership, channels, and other settings. |
| Graph layout selection | Select the Area layout within a tab, such as 1 Graph or 4 Graphs. |
| Current Set | Shows signals in use in a channel → frame → signal hierarchy. Expand/collapse with +/−. |
| Details | Check the selected signal's channel, communication type, ID, data length, bit position, conversion, unit, and other details. |
| Central Graph | Shows waveforms for signals assigned to Areas in the selected tab. |
| Graph Settings... | Opens graph settings to check assignments and auto arrange unassigned signals. |
| Values | Check displayed values and times. Use the selector, such as Time/Value, to change the column layout. |
| Bar Monitor | Shows numbers as bars when display targets are configured. |
| Status Monitor | Check Signal, Value, and Status. See Figure 5 for how to read the screen. |
| Display Settings | Check/change Monitor, Graph, assignments, Bar, Status, Alert, and other settings per signal. |
| Alert History | Opens alert activation/recovery history. |
When multiple signals share a name, check the channel, ID, and frame name instead of relying on the name alone. Select the same signal in Current Set, Values, and Display Settings and compare with Details.
Changing Display Targets
Expand Display Settings at the bottom. The following example assigns Target_RPM_demo to the value list and graph, and Fan_Phase_demo to the value list and status display.
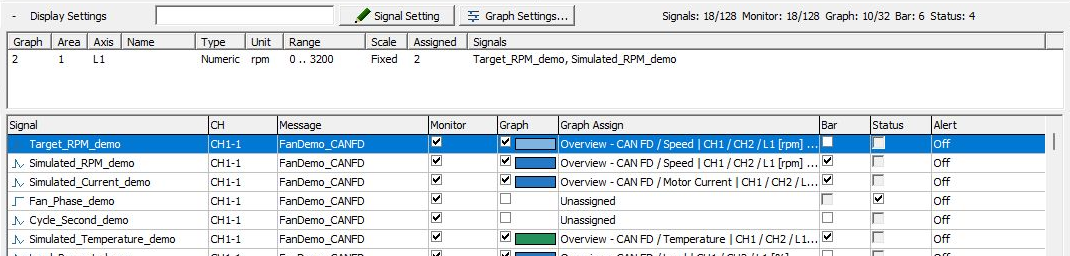
Figure 2. Display Settings for configuring display destinations per signal.
- Stop monitoring.
- Select the target signal in Display Settings.
- Configure the required Monitor, Graph, Bar, and Status displays. Editable items depend on the signal type.
- To edit details, click “Signal Setting” in Display Settings.
- To change waveform placement, use the Graph assignment field or graph settings.
Monitor indicates inclusion in the value list; Graph indicates waveform display. If Graph is on but the destination is Unassigned, configure an assignment.
Checks During Monitoring
Values update when monitoring is started and target frames are transmitted/received. In the Speed example, Raw value 30 converts to 10 km/h. Check the source data in Monitor Window.
In FanDemo, expanding CH1-1 in Current Set shows signals belonging to the ID 0x310 frame. Bar Monitor on the right displays actual rotational speed over a range of 0–3200 rpm.
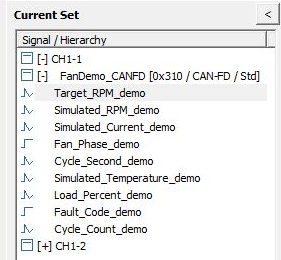
Figure 3. Signals belonging to CH1-1, ID 0x310.
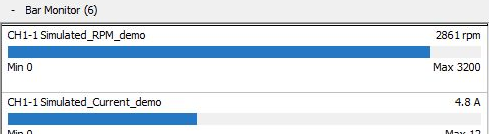
Figure 4. Bar Monitor displaying actual rotational speed.
For a state signal, compare Signal, Value, and Status on the same row in Status Monitor. In Figure 5, CH1-1 Fan_Phase_demo has Value Acceleration and Status Defined. Defined means a Logical definition matching the received raw value was found.

Figure 5. Checking the state name and its definition in Status Monitor.
Pausing Graphs Versus Stopping Everything
Pause/Resume on the toolbar pauses/resumes graph display. Do not use it to stop communication monitoring or log recording as a whole. To change definitions or communication conditions, use Stop at the top of the application.
Figures 6 and 7 show two points in time after pausing the graph while monitoring continues. A triangular Resume button appears at the top, and the waveform for CH1, ID 0x310, in the center remains fixed. Meanwhile, Values and Status Monitor on the right update, and Status at the bottom remains green and shows Monitoring.
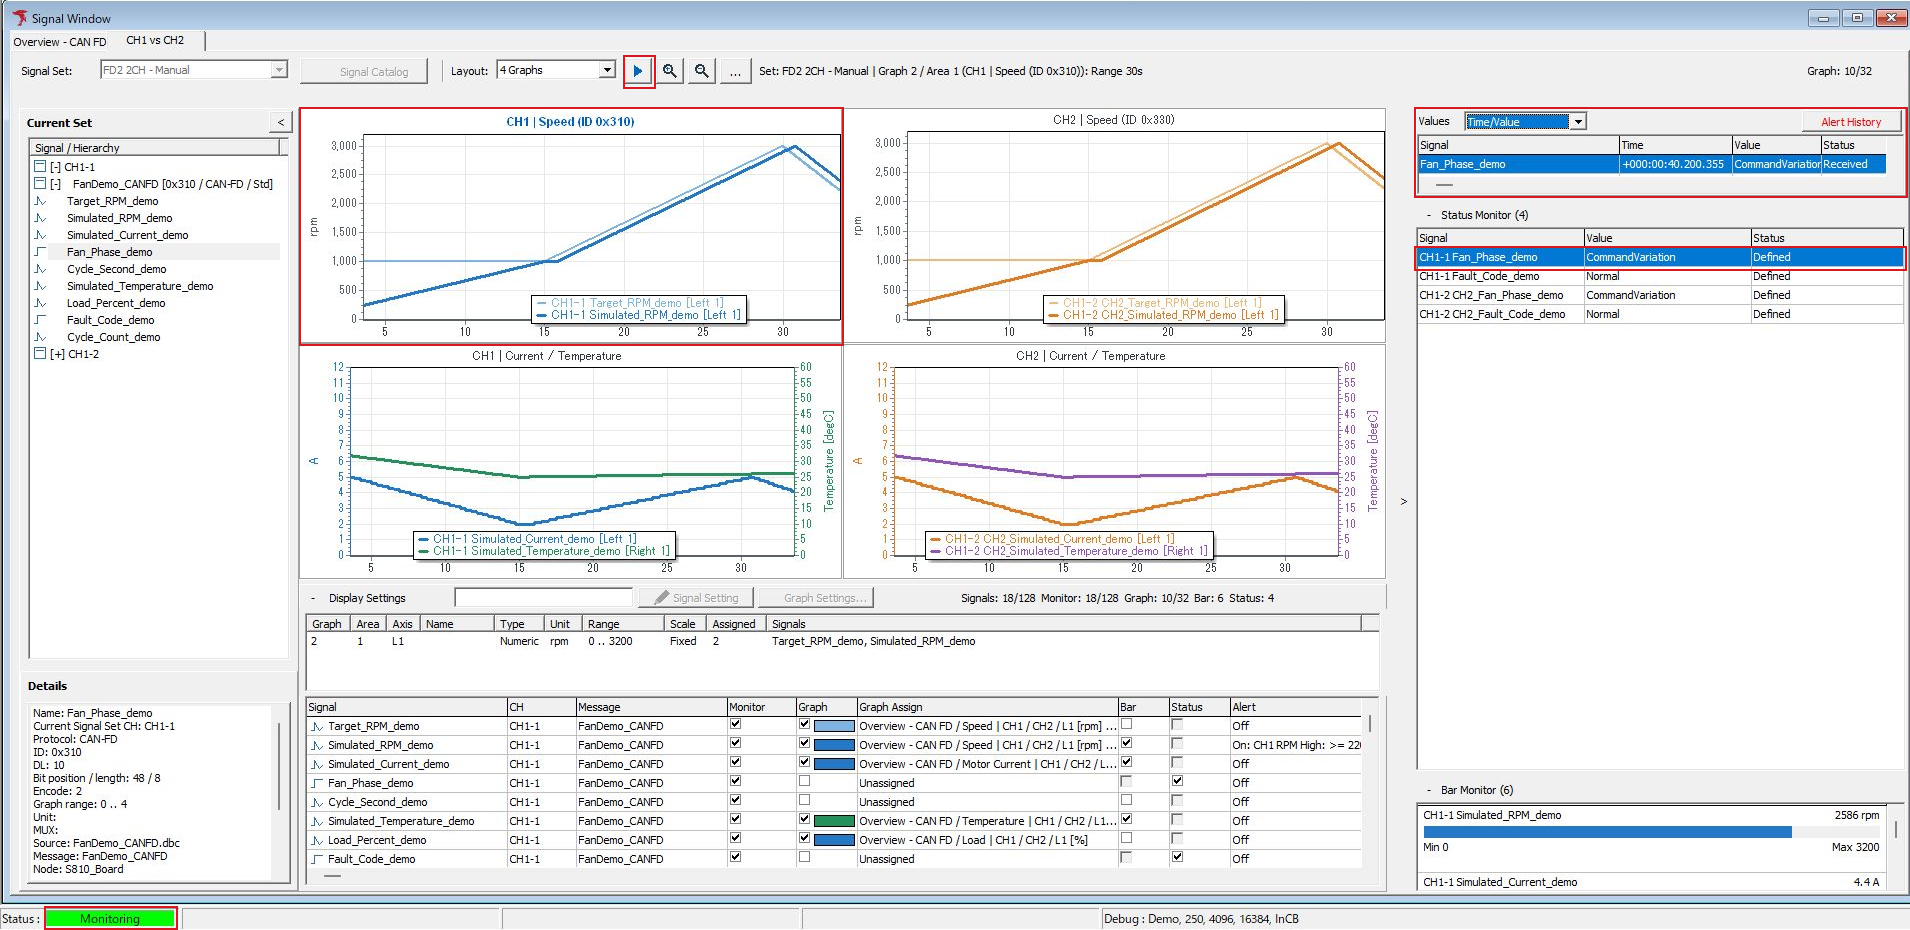
Figure 6. First point while monitoring continues with the waveform paused.
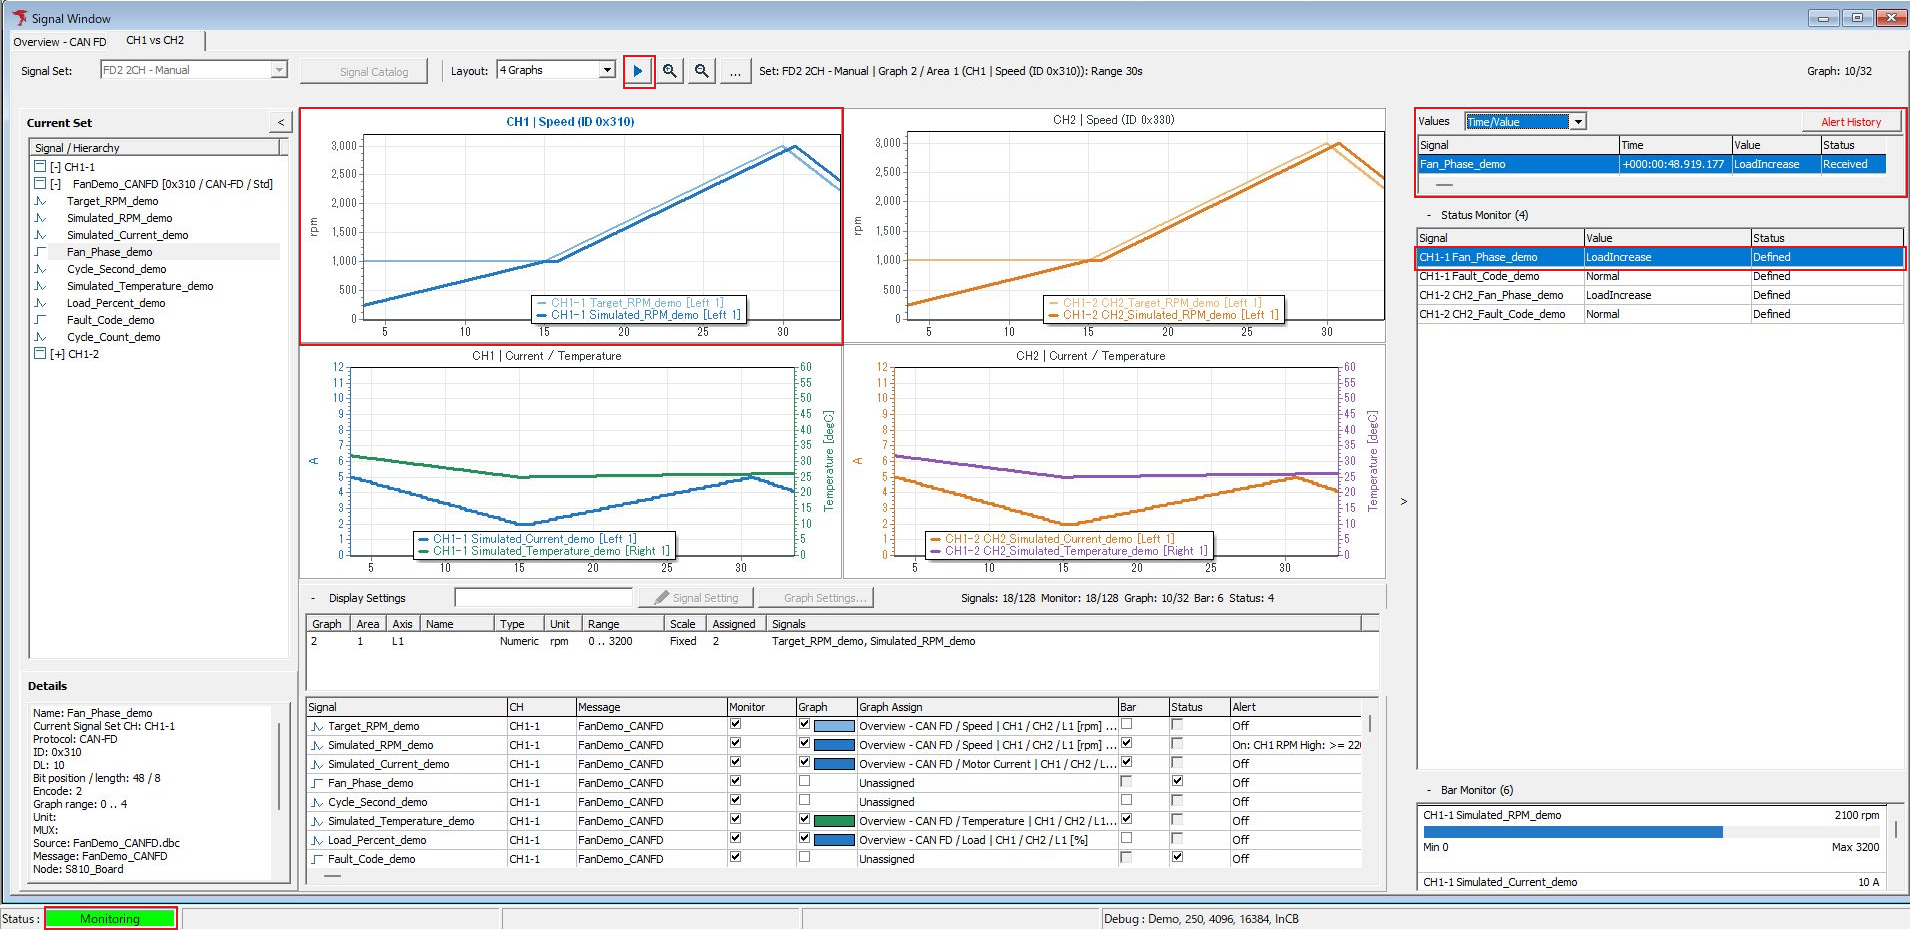
Figure 7. Second point, with values/states updated while the waveform remains fixed.
With Values in Time/Value format, compare update times and state names for the same signal.
- Figure 6:
CommandVariationreceived at+000:00:40.200.355. - Figure 7:
LoadIncreasereceived at+000:00:48.919.177.
Status in Status Monitor is Defined in both.
Click Resume to resume waveform updates. To stop all monitoring, click Stop at the top of the application and check that Status at the bottom returns to Setting.
Display Range and Selected Area
Zooming in/out or resetting the time range links the time axes of Areas within the same graph tab. Select the target Area before saving or copying its image.
Adjusting Display Regions
You can expand/collapse Current Set and Display Settings, adjust left/right boundaries, and change region heights. If a region is not visible, check its expand/collapse button, heading, boundary position, and horizontal scrolling. For the overall screen arrangement, also see Layout Settings.
If Nothing Is Displayed or Values Differ
| Symptom | Items to check |
|---|---|
| A signal is missing from Current Set | Check the active Set, the signal's In Set setting/channel assignment, and whether the tree is expanded. |
| A signal cannot be found in the Catalog | Check Catalog search conditions and the Only selected Set filter. |
| No Data or “-” appears | Monitoring started, actual frame reception, Monitor, CH, Protocol, Direction, ID, data length. |
| Unassigned appears | Use the display field and Details to distinguish an unassigned channel from an unassigned graph. |
| Values appear but no waveform | Graph enabled, tab/Area assignment, current layout, time range. |
| Number or sign differs | Endian, bit position, length, Signed, conversion formula, Value Table. |
| State name differs from expected | Raw-to-Logical mapping, target frame, reception direction. |
| Changing the unit does not change the value | Unit is a display name. Conversion requires changing the formula. |
| Only the bar range differs | Check the Bar range and shared graph axis range separately. |
| Only a particular multiplexed signal has no value | Selector value and that signal's multiplexing condition. |
| Settings cannot be edited | Stop monitoring and check whether analysis is running. |
Do not interpret a missing value as zero or normal. First check the source frame, then isolate the cause in the order of definition, channel, and display.
Analyze recorded logs with Signal Analysis. For transmission settings and initial-value editing using signal definitions, see transmission integration operations.