Signal Analysis Screen Layout and Checking Waveforms
Screen Layout
In Signal Analysis, select the analysis target at the top, then investigate information at the same timestamp using the central graph, Values on the right, and results below. Graph and result regions are not shown until a log is selected.
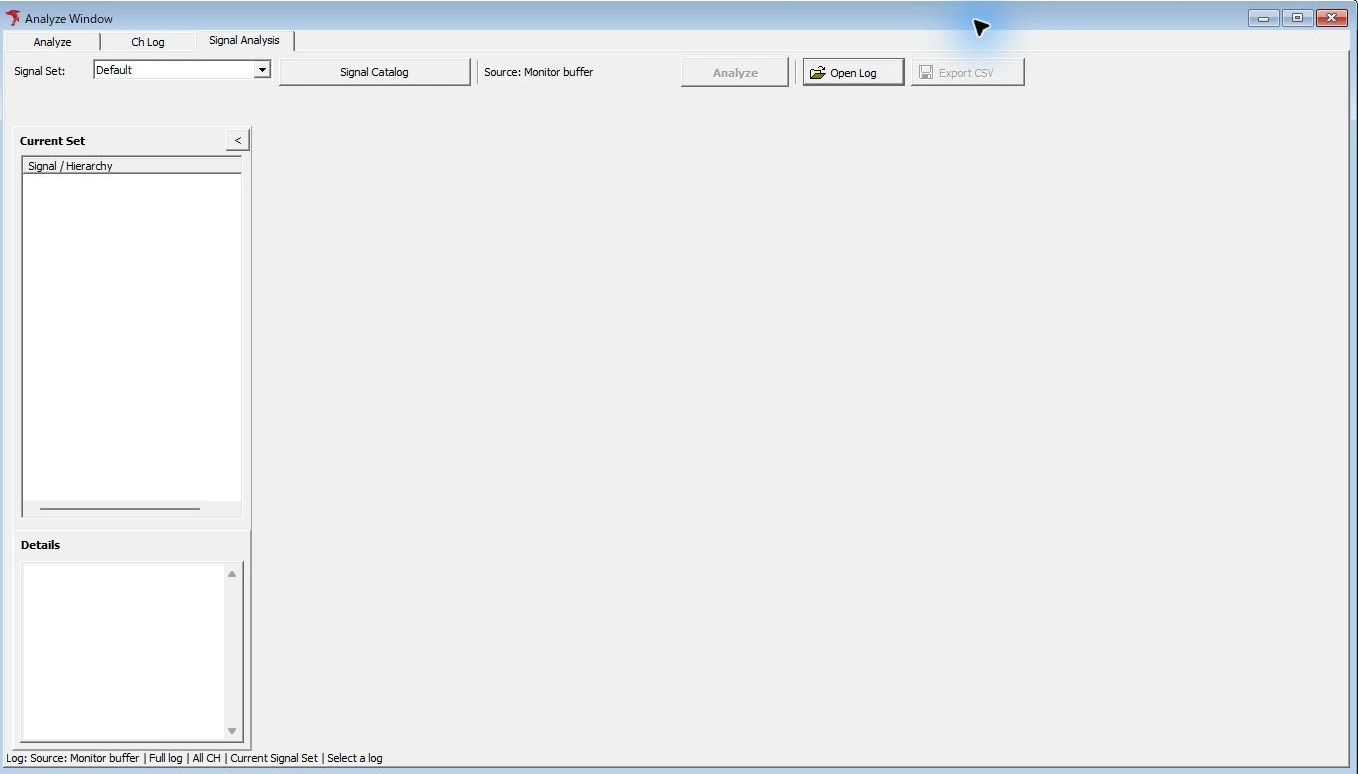
Figure 1. Checking analysis entry points in Signal Analysis before selecting a log.
Figure 1 shows the state before selecting a log. After analysis, the graph, Values, and result regions appear.
| Region / item | Operations and checks |
|---|---|
| Signal Set / Signal Catalog | Use “Signal Set” to select the Set for the next analysis. Use “Signal Catalog” to check or edit analysis definitions and channel assignments. |
| Source / Analyze | Analysis source and controls for initial analysis/reanalysis. Check that the adjacent Source identifies the intended log. |
| Open Log / Export CSV | Loads communication logs and exports analyzed signal values to CSV. |
| Current Set / Details | Select a signal in the hierarchy and check its definition or information about the selected item. |
| Graph 1 / Graph 2 | Switch waveform destinations. Use Layout to choose one view, two vertically/horizontally split views, or four views. |
| Values | Check signal values at the cursor time. Switch between Time/Value and Value/Data(Hex) to compare values and data. |
| Display Settings | Adjust display destinations, graph assignments, and other settings. Display concepts are shared with Signal Window. |
| Frame Log | Shows frames used for analysis. Selected signal only filters to frames related to the selected signal. LIN Header frames appear in the frame list and generate no samples on their own. To check a value, find its data-bearing source frame, such as a Response frame. |
| Alerts (count) | Check alert detections. Use “Show on graph” to toggle graph overlays. |
| Markers | Check A/B marker times, differences, and annotations. |
| Playback controls | Examine recorded log values by moving in time, changing playback speed, and pausing. No data is transmitted onto the bus. |
Selecting another Signal Set after analysis changes only the target for the next run; the graph and Values retain the previous results. Export CSV is disabled while reanalysis is required. Run Analyze before checking or exporting the new Set's results. The Default-to-Speed Line example shows the retained Stair waveform while reanalysis is pending and the Line waveform after completion.
Zooming In on Waveforms
- Select the target signal, Graph tab, and Area. This example uses CH1-1 Speed displayed in Graph 1, Area 1.
- Check displayed signals, axes, time range, and other settings in Graph Settings. Figure 2 has Range 60 s and horizontal-axis ticks every 10 seconds. For common settings, see Graph Display Settings.
- Click “Zoom In” at the top 3 times. In Figure 3, Range is 7.5 s and horizontal-axis ticks are every 1 second, making the same log's 7→12→9→7 km/h changes easier to see. “Zoom Out” expands the range; “Zoom Reset” under More Graph commands resets it.
- After zooming, double-click the first row in “Alerts” to move to the first occurrence time. The green cursor C at 2.003 s in Figure 3 results from this time navigation. Zooming and moving the display time are separate operations.
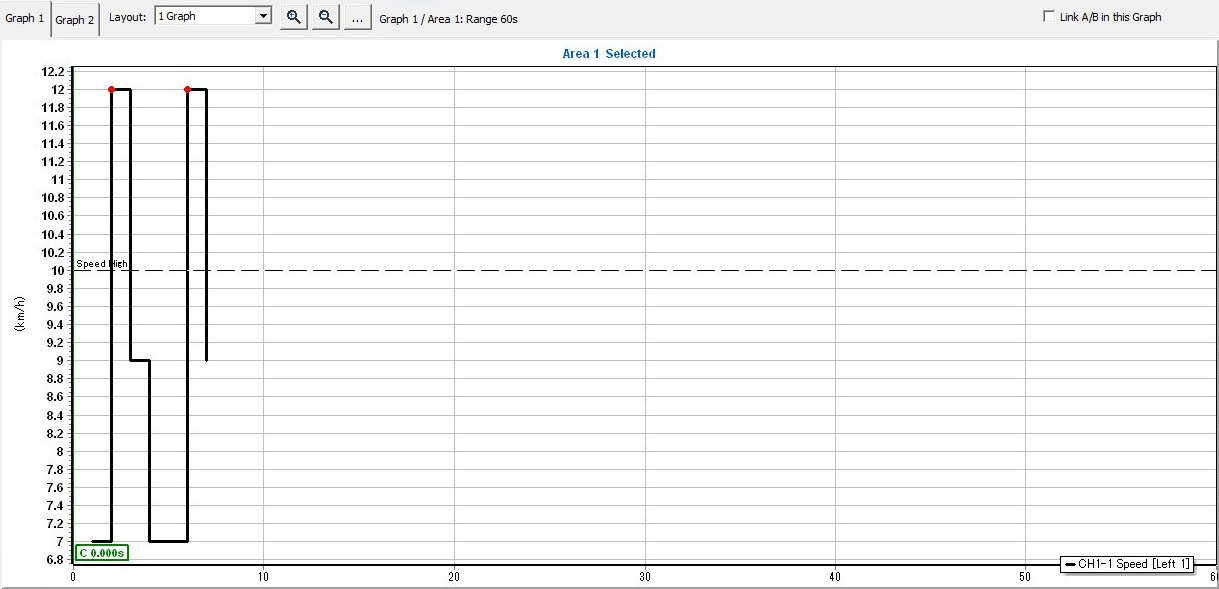
Figure 2. Before zooming: Speed waveform from the same log over a 60-second range.
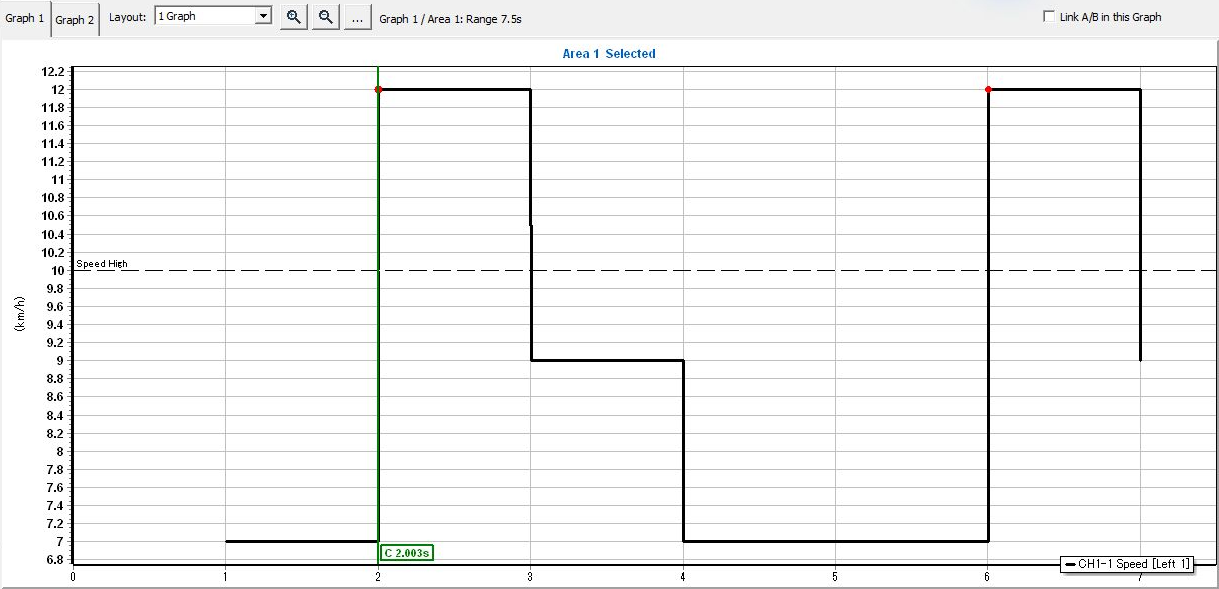
Figure 3. After zooming: checking steps over a 7.5-second range and moving to the alert occurrence time.
Figures 2 and 3 show the same log in graphs of the same size, with the same vertical axis and legend CH1-1 Speed [Left 1]. In Figure 3, check the first 7→12→9→7 km/h sequence. The horizontal dashed line at 10 km/h is the Speed High upper limit; the 2 red points mark separate alert occurrences. The first occurrence is at +0000002.002582 and its recovery is at +0000004.002580: recovery is the 9→7 step, not the 12→9 step. Compare Alerts timestamps and values so you do not mistake the second red point for the first recovery.
After navigating, also check timestamps and data in Values and Frame Log. If the target is missing from Frame Log, also check filtering by the selected signal.
Changing the waveform display range does not delete source log data or reduce the number of analysis input frames.
Arrange Signals Automatically
In Signal Analysis, select the destination Graph tab and open “Graph Settings” → “Auto arrange...”. Check the unassigned signals you want to plot and review “Proposed layout.” Select “Use layout” and click “OK” to apply it. See Arranging Unassigned Signals Automatically for details on eligible signals and the layout proposal.
If you switch Sets after completing an analysis, “Graph Settings” edits the Set for the next run. Check the Set name in the dialog, then click “Analyze” and wait for it to finish before checking that Set’s waveforms. The graph shows the previous results while reanalysis is pending.
Check Axes in a Range Without Samples
After analysis completes, the axes configured for signals in the selected graph remain visible when the time range has no samples to plot. The axis units, scale, and state labels reflect display settings. To check signal values, verify the Graph, Area, and time range, then move to a time with samples and compare Values with Frame Log.
Comparing with A/B Markers
- Select the signal, Graph, and Area to compare. This example uses CH1-1 Speed in Default, Graph 1, Area 1.
- Right-click slightly to the right of the rising step to 12 km/h and select “Set A here.”
- Right-click slightly to the right of the falling step to 7 km/h and select “Set B here.” Check the red A and blue B positions in Figure 4.
- Open “Markers” and check target
Default > Graph 1 > Area 1 Independent, the A/B timestamps and values, and Delta (B-A) (Figure 5).
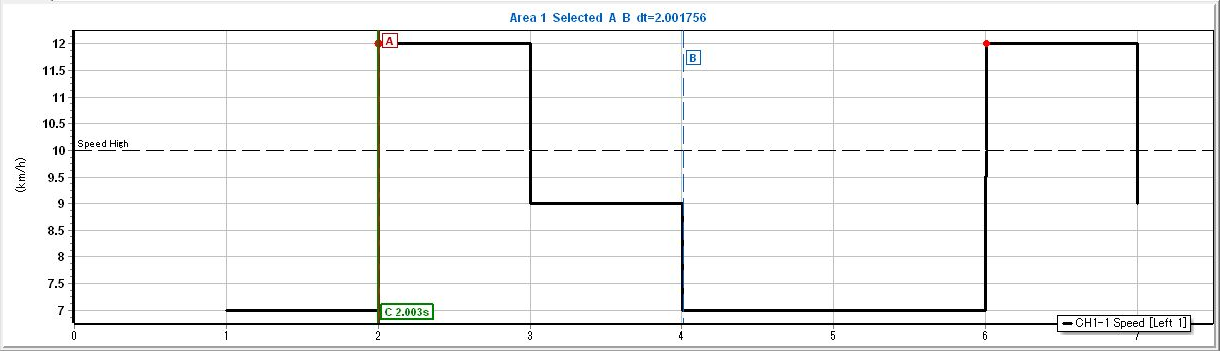
Figure 4. Placing A/B markers at 2 points on Speed.
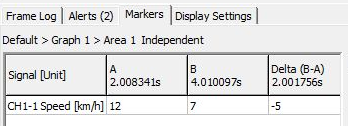
Figure 5. Checking time and Speed value differences in Markers on the same screen.
For CH1-1 Speed [km/h] in Figure 5, A is 12 at 2.008341 s, and B is 7 at 4.010097 s. The Delta (B-A) heading shows time difference 2.001756 s, and the Speed row shows value difference 7 − 12 = −5 km/h. Both differences subtract A from B.
A/B markers are placed at the time of the right-click position and do not automatically snap to sample timestamps. Values use the latest sample at or before the marker time. Figures 4 and 5 place markers just after the steps, so the A/B time difference differs slightly from the time between alert occurrence and recovery. The exact occurrence time 2.002582 s and recovery time 4.002580 s differ by 1.999998 s. Compare detailed timestamps in Alerts and Frame Log. The green cursor C is a display time independent of A/B; here it is at the occurrence sample's 2.003 s (rounded to 3 decimal places).
Drag the A/B lines to adjust marker positions. To remove one, right-click the graph and use “Clear A” or “Clear B.” To remove both, select “Clear A/B in this Area” when linking is disabled, or “Clear linked A/B in this Graph” when enabled.
Check the target Graph and Area when operating markers. Independent in this example means each Area is independent. Enabling “Link A/B in this Graph” links A/B across Areas within the same Graph for comparison. Do not confuse them with markers in another Graph.
Checking Alert Occurrences
Check alert conditions for the analysis Set, run Analyze, then investigate detected results under “Alerts.” For condition types, thresholds, durations, and recovery conditions, see Alert Settings. After changing conditions, check the state after reevaluation/reanalysis.
Figures 6–8 analyze the most recent monitoring log with Source Monitor buffer (Recent monitoring log, CH 1, records 14). Speed High (upper limit 10 km/h, Recovery margin 2) is configured in the analysis Default Set before running Analyze. This uses the same 7→12→9→7 km/h recording as the live monitoring example.
- Open “Alerts (2)” below and turn on “Show on graph.” Compare Signal, Rule, occurrence/recovery times, and values (Figure 6). Selecting a row highlights the target; double-clicking moves to its occurrence time.

Figure 6. Checking Speed High analysis results with Show on graph ON.
- The top Recovered row has Timestamp
+0000002.002582, Start Value 12, Recovery Time+0000004.002580, and Recovery Value 7. - The bottom Active row has Timestamp
+0000006.002581and Start Value 12. No recovery is recorded before the end of the analysis range, so recovery time and value are “-”.
- Double-click the top Recovered row. In Figure 7, playback stops and the green cursor C moves to the occurrence time. C on the graph is 2.003 s; Speed in Values on the right has Time
+0000002.002582and Value 12 km/h. C rounds seconds to 3 decimal places, so check the detailed timestamp in Values.
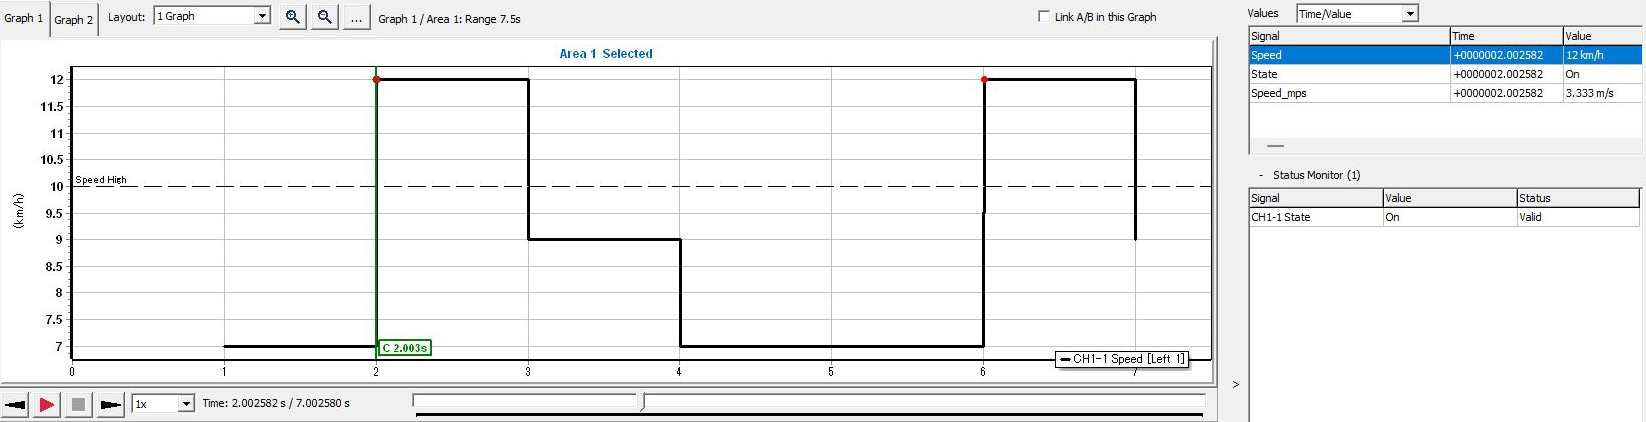
Figure 7. Comparing the waveform and Speed value at alert occurrence.
- To check recovery, open “Frame Log” and double-click the row with Time
+0000004.002580. The selected row in Figure 8 has CH1-1, Direction Tx, ID 10 (hexadecimal 0x10), Length 2, and Data (HEX) “18 01”. Green C moves to 4.003 s, and Speed in Values becomes 7 km/h at the same timestamp.
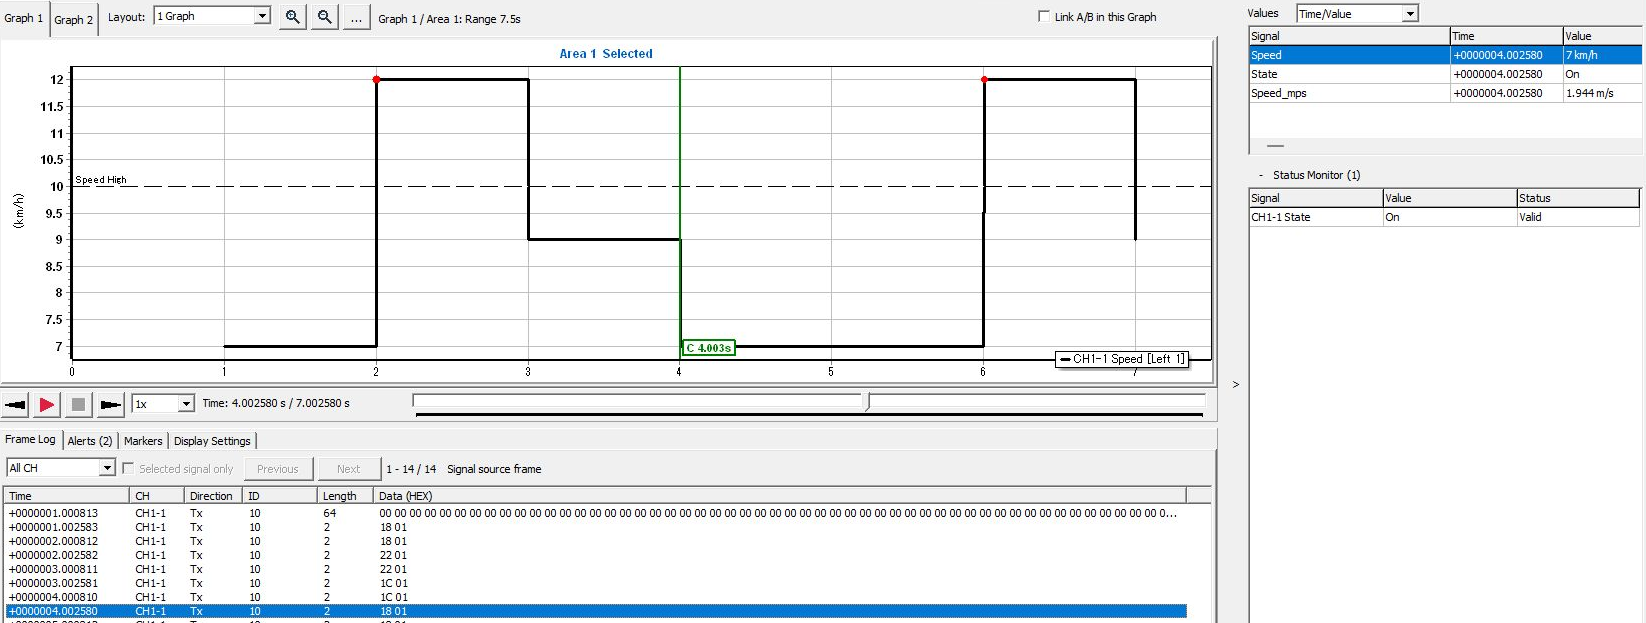
Figure 8. Comparing the source frame, waveform, and Speed at recovery.
Check the dashed upper-limit line at 10 km/h and the red occurrence point in Figures 7 and 8. The condition stays active at the intermediate 9 km/h, then recovers at 7 km/h, below 10 − 2 = 8 km/h. First byte 0x18 in “18 01” is Raw value 24, matching Speed's conversion 24 × 0.5 − 5 = 7 km/h. Direction in Frame Log is the recorded transmission/reception direction; double-clicking a row moves the analysis display time.
“Alerts” shows results for the selected analysis log and conditions. Distinguish these from Alert History accumulated during monitoring and from Signal Trigger, which starts/stops log recording.
Adding Annotations
- Check the time to annotate. This example uses the Speed High occurrence time
+0000002.002582in Alerts in Figure 6. - Right-click Area 1 in Graph 1 and select “Add Annotation Here.”
- In Annotation in Figure 9, set Title to
Speed High, Comment (optional) toSpeed reached 12 km/h, and Time (seconds) to2.002582. Select “This Area” for the scope and confirm with “OK.”
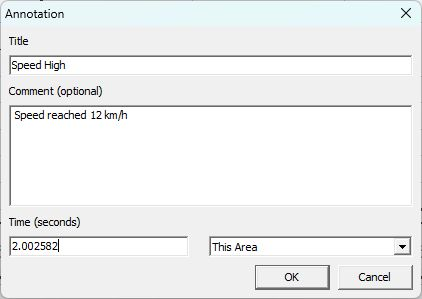
Figure 9. Adding an annotation with the occurrence time and a note.
Time (seconds) initially contains the time of the right-click position on the graph. To match a sample or alert precisely, enter the verified timestamp directly. This example's This Area displays it in Graph 1, Area 1. “This Graph” displays it within the same Graph, and “All Graphs in this Set” within all Graphs in the same Set.
- Check Time, Title, Graph, Area, Scope, and Comment in the annotations list under “Markers.” The selected row in Figure 10 is
+0000002.002582, Speed High, Graph 1, Area 1, This Area, Speed reached 12 km/h. - Move to another time, then double-click the annotation row. Playback stops and the display moves to the annotation time. In Figure 10, green cursor C is 2.003 s, and Speed in Values has Time
+0000002.002582and Value 12 km/h. Since C is rounded to 3 decimal places, compare detailed timestamps in the annotation row and Values.
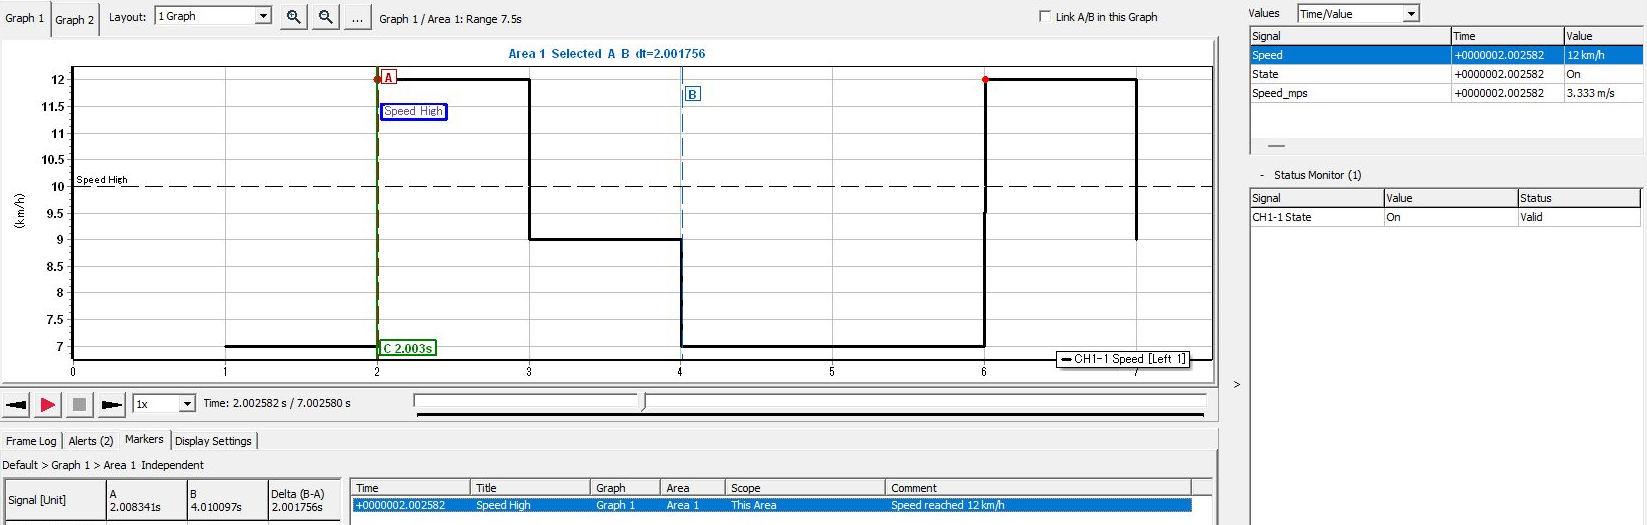
Figure 10. Moving from the annotation row to the occurrence time and checking the waveform and Values.
To edit an annotation, right-click its row and select “Edit Annotation.” An annotation is a note attached to an investigated position. The annotation in Figure 10 has the same name as the alert, Speed High, but adding or editing annotations does not change alert conditions or detected results.
Annotations are retained within the session for the currently open log. Record any required times, titles, and comments separately before switching logs. Do not assume annotations are saved in MPXSIG or analysis CSV files.